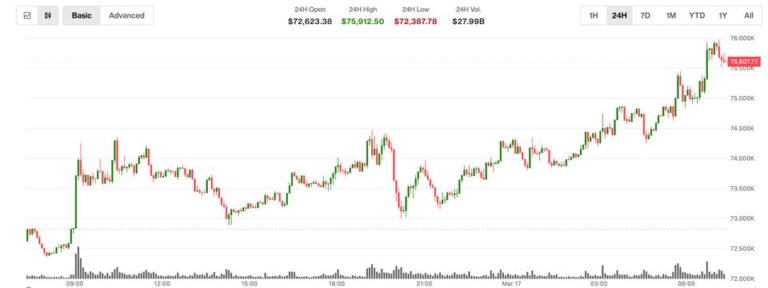
Bitcoin BTC$75,189.53 surged past $75,000 early Tuesday, helped by shifting dynamics in the derivatives market.
Prices hit a high of $75,800, convincingly topping the long-term resistance corridor between $73,750 and $74,400, which reversed price trends three times since 2024, according to CoinDesk data.
The so-called bullish breakout happened as traders closed bearish short positions initiated during the early February sell-off.
“In bitcoin, the recent move has been driven largely by sizeable put selling around the $55,000 and $60,000 strikes, as traders increasingly recognized that these options were unlikely to expire in the money with only days remaining. The unwinding of these downside hedges has contributed to the latest bullish price action,” Markus Thielen, founder of 10x Research, said in a note to clients.
A put option is a derivative contract that gives the right to sell the underlying asset, in this case, BTC, at a fixed price before a certain date. Traders buy puts when they think the price might fall or when they want protection against losses. It’s basically an insurance against price drops, while a call option provides upside exposure.
Traders aggressively bought put options at $60,000 and lower levels in early February as bitcoin crashed, nearly hitting the $60,000 on some exchanges. However, since then, market sentiment has stabilised, forcing traders to reassess their bearish positions.
The unwinding of these bearish bets also has second-order bullish effects.
“The selling or closing of Bitcoin put options reduces downside hedging pressure and forces market makers to buy BTC to rebalance their exposure, creating supportive flows that can push prices higher,” Thielen said.
CoinDesk warned last week that the rally could accelerate as prices near $75,000, largely due to market makers’ expected hedging activities.
So far, however, there has not been a significant upside call buying. This suggests the move has so far been driven more by hedge unwinds than by aggressive bullish positioning, Thielen explained.
Altcoins surge
Bitcoin’s rally has lifted the broader crypto market, with the CoinDesk 20 Index gaining 5% to 2,202 points over the past 24 hours.
Ether (ETH) has gained nearly 8% to $2,360, helped by increasing demand for bullish options bets. XRP (XRP) and solana (SOL) have gained 8% and 4%, respectively.
ZEC, PEPE, DOT, and VIRTUAL are other standout performers.
Few people are as close to the center of the Bitcoin industry as Jack Maller. A young, tech-savvy CEO of a major Bitcoin exchange in the United States, partnered with Tether, the most profitable company in recent history, the son of Chicago traders, Jack, is plugged in. In his podcast, BLABLA, he has been ringing the bell over the past few weeks, “It’s time to turn on your DCA”.
Nobody knows where price is going to go, but according to historical data, now is a good time to turn on your DCAs if you believe bitcoin is not going to zero.
We have no-fee and no-spread for both DCAs and paycheck conversions at @Strike. Free withdrawals to cold storage too.… pic.twitter.com/AL89nSYR6o
But what does DCA even mean? An acronym for “dollar cost average,” it is an investment strategy ported into Bitcoin that has become the gold standard recommendation to Bitcoin fans across the industry. Turning on your DCA means buying bitcoin on a regular basis, regardless of the price. Why does this work? Well its quite simple actually. If you buy regardless of the price on a weekly basis for example, you will buy as much of the lower prices as you will the higher ones. In fact, bitcoin tends to spend significant portions of time in ‘consolidation’, which is another word for neither going up nor down, but rather going sideways. This is a great opportunity to accumulate sats.
Every time you buy bitcoin at a price lower than you bought before, you are lowering your ‘dollar cost average’ or rather, the average cost of your total bitcoin in dollar terms. Eventually, because of Bitcoin’s unmatched and inelastic scarcity, combined with its network-like growth, the price tends to go up, and when it goes up, it does so quickly. Most people miss the opportunity to buy at the perfect time, right before a major move up. But Bitcoiners doing DCA will already have an optimal average price, perfectly set up to profit from a large move up. As a result, you can end up with an average purchase price curve that looks something like this, right before a major bull run.
There are other profound benefits to the Bitcoin DCA strategy. Because it involves small, manageable investments over a long period of time, the amount risked at any single point in the investment journey is relatively small. Investing, for example, 10% of your disposable income a month in Bitcoin would not be a heavy burden, making bear markets not just tolerable but actually turning them into incredible investment opportunities.
Multiple exchanges have also implemented automated Bitcoin DCA features, such as Kraken, Strike, Swan, and Bull Bitcoin, which cover many countries throughout the world. The automated aspect of this strategy can not be overstated. Compared to the high stress, intense cognitive load of a professional trader, automated Bitcoin DCA is a walk in the park, and it yields comparable results!
Books like The Art of Execution cover long-term studies done on professional traders on Wall Street, demonstrating that most lose money, and of those that do earn money, lose for 10 years straight before becoming good enough to make it. The human capital required to become a good trader is not cheap, but Bitcoin DCA is set it and forget it; you can go do something else with your life while your Bitcoin stack grows.
You can calculate the long-term value of the Bitcoin DCA strategy with a variety of tools online, such as this BM Pro calculator which lets you see what would have happened if you had started buying say $100 of Bitcoin every two weeks, back in 2017. Needless to say, the results are incredible.
In recent years, Gold has started performing very well with DCA as well, but those calculations are mostly dwarfed by its meteoric rise in 2025. Historically, Gold has much longer cycles than Bitcoin, and can easily stay still for many years after a big move, being the giant that it is. Whereas Bitcoin has a lot more upside overall and its cycles are much shorter, arguably leading to better returns if played right.
Now Is The Time To Start Your DCA
Why now, you might ask? Isn’t it always good to have your Bitcoin DCA on? Well, there’s a great question, and implicit in Jack Maller’s quote, the answer is no. Technically, you can start your DCA at the top of a bull market and end up with a great average down purchase price by the time the next bull market takes off. But you certainly would be better off not buying the top.
The following is not investment advice and does not represent the opinion of Bitcoin Magazine or BTC Inc. They are the opinions of the author alone.
The problem, of course, is that no one knows where the top of the market is; if they did, they’d be rich! Their strategy would get discovered, replicated by others, removing its competitive advantage over time. That’s the nature of markets; secret knowledge only works while it is secret. When it becomes public, the rest of the market adapts.
Since Bitcoin DCA does not attempt to price the top, it avoids the issue entirely. But many people turn off DCA when they feel the market is nearing a top, and tops historically only happen after crossing the previous all-time high price from a previous cycle. So, despite the math, some do turn off their DCA, only to turn it back on when a clear bear market has begun.
So is Bitcoin in a bear market? Sort of. The price is down 50%From the top, but it also dropped very quickly, suggesting a reaction to larger macro events, which in turn means that most of the pain is likely behind us. There’s also a variety of technical price indicators that are flashing green, suggesting we are far closer to the bottom than we are to the top. In other words, it is time to get in.
Weekly RSI, a momentum indicator, is in oversold territory historically for Bitcoin. You can go back a decade in Bitcoin, and every time the weekly RSI reaches levels this low, it signals a bottom. The Mayer multiple, which compares Bitcoin to the 200-day moving average, is also in the buy zone territory.
The fear and greed index for Bitcoin and the broader crypto market has been at extreme fear for a while now, and you know what they say. If there’s blood on the streets, it’s time to buy.
There’s also a historical analysis that looks at percentage-based corrections in Bitcoin from the top of the market to the bottom. These corrections tend to be smaller over time, with the last bear market drawdown going as far down as 77%. We are currently at about 51% correction, if we were to go down 70%, it would mean we are already more than half way down. So closer to the bottom than we are to the top.
Notice we are already halfway through the Bitcoin halving cycle as well, with the next halving expected in early 2028. The last halving was anticipated with bitcoin making all-time highs near the halving, as the metric has become widely known, for the same reasons, we might see an anticipation of the halving again this cycle. Historically speaking, we are not likely to see a correction deeper than 70% from the top, an extreme scenario that would push Bitcoin to $40,000 temporarily.
Dips of the sort are also less likely given the institutional adoption of Bitcoin, which has massively expanded the liquidity of this market. If we did go that far down, those prepared to buy would find an incredible opportunity, but it would be speculation and a trading mindset to try to catch the absolute bottom, hence why low-risk, consistent DCA is so great.
Finally, we have the death cross and colden cross combo. Pitting off the 50-day moving average versus the 200-day moving average leads to a fairly predictable dynamic. Markets sell before the 50-day crosses below the 200-day. And they pump before the 50-day crosses above the 200-day. Bitcoin has now crossed above the 50 day moving average, if it can stay there or continue to consolidate around the $70,000 mark, it will be very well positioned for a run up deeper into 2026 as the golden cross occurs, probably signaling the beginning of a new bull market.
Macro Economic Trends
AI stonks have been soaking up a lot of liquidity and investment this cycle, with roughly a trillion dollars invested in AI infrastructure in the past handful of years. The market is broadly bullish on AI continuing its disruption path. I don’t think it takes a genius to say that an “AI fear and greed index” would be way over on the greed side right now. It may be that AI has brought us to a new paradigm of only up for AI stocks and tech, but that kind of thinking is usually a sell sign. If there is some sort of event in the next year or two akin to the dot-com crash that leads to a serious AI correction, we may see speculative and investment capital look for other options beyond AI, bringing liquidity back to Bitcoin. Though it is arguably still early to call this.
Meanwhile, U.S. debt yield, or the interest on the debt of the U.S. Government, has stalled out with signs from the FED that lower rates are coming. Trump nominated Kevin Warsh as the next Chair of the Federal Reserve back in January, and his confirmation — while stuck in the Senate — is likely to go through soon, signaling a looser monetary policy, aligned with Trump’s broader economic strategy, which favours lower interest rates and more money printing, coupled with aggressive growth and deregulation.
The Fed funds’ effective fund rate is also trending down, signaling cheaper money coming into the market, likely in part due to more money printing by the Fed, since U.S. bonds are not particularly attractive to foreign investors during this time of geopolitical tension.
Fundamental Analysis
As far as fundamental trends or changes to Bitcoin, the only question that has emerged is in relation to quantum computing and whether it can break Bitcoin’s cryptography. This fear, uncertainty, and doubt (FUD), while new to many investors, is not new to Bitcoin technologists. Broad consensus within the Bitcoin industry remains that quantum computing advancements remain mostly hype and have a long way to go before they become a threat to Bitcoin.
Meanwhile, Bitcoin core developers have been actively discussing long-term solutions to quantum for at least a couple of years now, though as far back as the Satoshi era. Formal improvement proposals have already been drafted, and software is well on its way to reach maturity, should it be needed to deal with a quantum threat. So overall, investors who sold due to quantum FUD might find themselves on the wrong side of the trade.
The Barrier To Entry Into Bitcoin
So yes, most signs suggest that it is time to turn on your Bitcoin DCA. And the good news is, there are only a couple of things people need to really understand about Bitcoin to benefit from it. Why is its supply limited, and how does it remain limited? And how to protect it long term via good self-custody. These essential skills in Bitcoin are not trivial to acquire; they do demand some study and interest from investors, but they are simple hobbies compared to the knowledge requirements of becoming a professional trader or investor who can survive the volatility and unpredictability of the market.
In terms of understanding Bitcoin’s economics, Bitcoin Magazine has a premium selection of books on the topic, any of which is likely to give you the fundamentals and much more in an eloquent and enjoyable way. And when it comes to self-custody, Bitcoin Magazine also has a fresh review of excellent tools, written by yours truly, for the year 2026.
Bithumb, one of South Korea’s leading crypto exchanges, has been fined by the country’s anti–money laundering and counter-terrorism financing agency.
South Korea’s Financial Intelligence Unit (FIU) has slapped a 36.8 billion won ($24.6 million) fine and ordered a six-month partial suspension after finding millions of violations of the country’s anti-money laundering rules.
The sanctions stem from violations of the Act on Reporting and Using Specified Financial Transaction Information, the Financial Services Commission said, according to local media.
According to the FIU, Bithumb committed about 6.65 million violations. Around 3.55 million involved failures to carry out required customer identity verification, while 3.04 million were related to cases where the exchange failed to properly block transactions that should have been blocked.
The suspension targets services for newly registered users. Existing customers will still be able to trade and move funds on the platform, according to initial reports on these sanctions.
Regulators also issued personnel penalties. Bithumb’s chief executive received a reprimand warning, while the exchange’s reporting officer was suspended for six months.
The violations surfaced during on-site inspections of South Korea’s five largest crypto exchanges, Upbit, Bithumb, Coinone, Korbit and Gopax, conducted between 2024 and 2025.
The case comes as South Korean regulators tighten oversight of the crypto market. Last year, the FIU handed Dunamu, the operator of the country’s largest exchange, Upbit, a three-month partial suspension and a 35.2 billion won fine for compliance gaps. Korbit, a rival platform, faced a smaller penalty of 2.73 billion won, along with institutional warnings.
Bithumb, founded in 2014, ranks among the largest exchanges in South Korea by trading volume, according to CoinGecko data. The partial suspension comes just a month after Bithumb mistakenly distributed billions of dollars worth of bitcoin to users.
CoinDesk has reached out to Bithumb for comment, but hasn’t heard back at the time of writing.
The U.S. Securities and Exchange Commission (SEC) ended its civil enforcement action against BitClout founder Nader Al-Naji and several related defendants, saying the decision was “based on the particular facts and circumstances of this case.”
In a joint stipulation filed March 12, the U.S. District Court for the Southern District of New York, the SEC and Al-Naji agreed to close the case, ending the litigation permanently and preventing the agency from refiling the same claims.
The SEC filed the lawsuit in July 2024, accusing Al-Naji of violating securities laws through the crypto-based social network project BitClout, later associated with the decentralized social blockchain DeSo. The SEC and Department of Justice charged Al-Naji with wire fraud and the sale of unregistered securities.
The charges claimed Al-Naji raised approximately $257 million from the sale of BitClout’s native token, BTCLT. They alleged he led investors to believe the money would be used to pay him and other BitClout employees, but instead spent “more than $7 million of investor funds on personal expenditures,” renting a mansion in Beverly Hills and “extravagant cash gifts.”
The case also named several “relief defendants,” including Buse Desticioğlu Al-Naji, Joumana Bahouth Al-Naji, Intangible Holdings LLC, Firestorm Media LLC, Viridian City LLC and the DeSo Foundation.
BitClout, which debuted in early 2021, was promoted as a proof-of-work blockchain designed to run and monetize social media, but quickly drew controversy. The platform automatically created profiles for prominent figures by scraping their accounts on X, then still known as Twitter, without consent, prompting a cease-and-desist letter from law firm Anderson Kill alleging violations of California’s right-of-publicity law, CoinDesk reported at the time.
Critics also argued the project’s “creator coin” model could incentivize reputational attacks, because users could profit from shorting someone’s token while damaging their reputation. Others raised concerns that users had to convert bitcoin into BitClout’s BTCLT token to use the platform without an easy way to convert it back, effectively locking funds on the site.
Despite the backlash, Al-Naji said the project attracted backing from major venture firms including Andreessen Horowitz, Sequoia, Coinbase Ventures and Digital Currency Group.
Al-Naji and the relief defendants waived any claims for attorney’s fees or damages related to the investigation or litigation.
This week, bitcoin strutted back above $70,000 like it owns the joint — and if Bitfinex’s latest Alpha report is right, the market may be quietly setting the stage for a rather dramatic encore. Bitcoin’s $70K Comeback Could Be Just the Opening Act, Bitfinex Analysts Say Bitcoin is heading into the March 18 Federal Open […]
WHY THIS MATTERS: The foundation of effective SME lending rests on reliable, transparent credit assessment. This initiative from iwoca addresses a critical flaw in the UK’s small business financing ecosystem: a fundamental breakdown of trust and comprehension regarding credit reporting. With half of all business owners either ignoring or misunderstanding their credit health, the sector suffers from high rejection rates and wasted application effort. The launch of a free, educational tool that demystifies creditworthiness—combining standard scores with public data and eventually utilizing Open Banking insights—is a significant step toward enhanced financial inclusion. It repositions credit monitoring from a punitive, gatekeeping function to an active, educational component of business management, forcing traditional credit bureaus to justify their opacity. For the fintech sector, this is a clear move towards product-led acquisition, where value-add tools precede the core lending relationship.
New research from iwoca, one of Europe’s leading SME lenders, reveals that a significant proportion of UK SMEs lack a clear understanding of their own financial health – a gap that could put their success at risk.
New SME research from iwoca shows that 51% of UK businesses either haven’t checked their credit score (30%) recently or are unsure what it means (21%). Only 20% of business owners trust credit agencies to assess their business’s health.
In a separate study of finance experts, iwoca’s latest SME Expert Index (Feb ‘26) reveals that most brokers believe rejected businesses often lack both understanding of why their finance applications have been unsuccessful (62%) and guidance on improving their creditworthiness (71%).
To bridge these knowledge gaps and empower small business owners to actively manage their financial health, iwoca is launching Credit Compass – a free tool designed to give every UK SME clear insight into their business’s credit standing. iwoca’s Credit Compass not only shows small businesses their credit data and how it evolves over time, but also explains what it means and what to do next to improve it. The free tool provides a breakdown to SMEs of the following categories:
Equifax Business Credit Score: instantly shows business owners how lenders view their business’ creditworthiness.
Credit History: tracks business owners’ reliability in managing payments and credit, helping build trust with funders and suppliers.
Financial Status: measures business owners’ cash flow strength and resilience – their ability to weather financial ups and downs.
Companies House Assessment: checks business owners’ stability and credibility using official public records.
Later this year, Credit Compass will integrate with Open Banking, allowing SMEs to securely connect their business accounts. This will enable iwoca to help businesses uncover valuable operational insights and make recommendations on how to strengthen their credit-worthiness.
Christoph Rieche, CEO and co-founder at iwoca, commented: “It’s concerning that more than half of all business owners neither understand nor monitor the credit score of their business. One of the reasons is that business credit scores have historically been unreliable, therefore business owners may have learned to ignore them. We’re committed to making them reliable and actionable over time, our massive data warehouse and experience in SME lending puts us into an ideal position to solve this problem. If successful then millions of SMEs will benefit from it.”
Olusegun Shiroye, founder of Bolfis Limited commented: “Business owners shouldn’t be flying blind, especially in such a tough economic environment. I’d never tracked my business’s financial health before – which may have stifled some of my growth over the years – but iwoca’s tool was straightforward to use and breaks everything down into categories that actually make sense. It’s definitely a useful resource for keeping tabs on where your business stands – and it’s free, so why not use it?”
Businesses can use the Credit Compass today at [link].
FF NEWS TAKE: This launch is more than a free service; it’s a proactive challenge to the dominance of opaque, legacy credit bureau models. By empowering small businesses with clear, actionable data, iwoca drives the adoption of better financial habits, setting the stage for smoother future lending. This fundamentally moves the needle by embedding proprietary credit education within the SME lending funnel. We must now watch the traction and efficiency gains following the Open Banking integration—that is where Credit Compass could truly deliver on its promise of reliable, actionable credit guidance.
Ether (ETH) bulls are eyeing a move back toward $2,800 in March, with at least three indicators showing ETH price potential to rise higher.
Key takeaways:
Ether’s price jumped by over 9% toward $2,280 on Monday.
Multiple indicators, including a symmetrical triangle, hint at an extended price rally toward $2,800.
Ether invalidates a bearish chart pattern
On Sunday, Ether’s price action invalidated what initially appeared to be a bear pennant on the daily chart.
Related: Ethereum Foundation sells $10.2M worth of ETH to BitMine in OTC deal
The ETH/USD pair pierced through the pennant’s upper trend line at $2,100, jumping 9.8% to a six-week high of $2,287 on Monday. Its breakout came alongside a rise in trading volume, implying stronger conviction behind the rally.
The price also reclaimed two key support lines in the name of the 20-day exponential moving average (EMA, red line) and the 50-day EMA (yellow line) at $2,072 and $2,210, respectively.
That simultaneously increased the odds of a symmetrical-triangle bullish reversal.
A symmetrical triangle forms when price makes lower highs and higher lows, compressing into a tightening range. It resolves when the price breaks either of the trendlines and moves by as much as the pattern’s maximum height.
In Ether’s case, the measured move above the upper trend line points to about $2,850, 26% above the current price. The level aligns with the 200-day EMA (the purple line), as shown in the chart above.
Ether’s next hurdle is the 100-day EMA (blue) near $2,500.
As Cointelegraph reported, a rejection there would weaken the breakout and raise the odds of a pullback.
Onchain data caps Ether’s upside at $2,800
ETH has been oscillating within a wide range defined by the realized price at $2,350 on the upside and on the downside at the lowest MVRV band of $1,650.
The chart below shows that the recent rebound off the lowest MVRV band mirrors the market structure observed in Q2 2022, where the price rallied past the realized price before being rejected by the first MVRV band just above.
This similarity reinforces the outlook that the current recovery attempt could be stopped around $2,650, where the first MVRV band sits above the realized price.
Glassnode’s Entity-Adjusted UTXO Realized Price Distribution (URPD), showing at which prices the current set of ETH UTXOs were created, also revealed a dense supply zone at $2,770-$2,880 that has been gradually maturing into the long-term holder cohort. This is where investors acquired more than 7.9 million ETH.
This unresolved supply overhang remains a persistent source of sell pressure, likely to cap attempts around the $2,800 level.
ETH: Entity-Adjusted URPD. Source: Glassnode
Meanwhile, ETH’s cost-basis distribution heatmap shows a heavy accumulation near $2,800, where more than 3 million ETH were previously purchased, suggesting a potential pathway toward this level in the short term.
Polymarket’s odds of $2,800 ETH price in March rise
Polymarket, a crypto-based prediction market where users trade contracts on real-world outcomes, is showing a clear bullish shift for Ether in March.
Traders now assign 13% odds that ETH reaches $2,800 in March, a 10% increase over the last 24 hours. The $2,600 and $2,400 targets carry even stronger convictions at 32% and 69%, respectively.
ETH price targets for March. Source: Polymarket
At the same time, the odds of the ETH price reaching $1,800 and $1,600 in March are priced lower than before, suggesting the crowd is trimming downside expectations.
This article does not contain investment advice or recommendations. Every investment and trading move involves risk, and readers should conduct their own research when making a decision. While we strive to provide accurate and timely information, Cointelegraph does not guarantee the accuracy, completeness, or reliability of any information in this article. This article may contain forward-looking statements that are subject to risks and uncertainties. Cointelegraph will not be liable for any loss or damage arising from your reliance on this information.
The bitcoin price climbed above $75,000 on Monday evening extending a sharp rebound that has lifted the asset nearly 25% from its February lows and reignited bullish sentiment across the crypto market.
The world’s largest cryptocurrency broke through the psychological $75,000 level during U.S. trading hours after spending several weeks consolidating in a tight range.
The move marks Bitcoin’s strongest price since early February and reflects improving risk appetite across global markets.
Bitcoin price’s latest surge comes after the asset bottomed near $63,000 in February during heightened geopolitical tensions linked to the Iran–Israel War. Since then, prices have staged a steady recovery as macroeconomic conditions stabilized and investor confidence returned.
Bitcoin’s price has outperformed other assets like gold and the S&P 500.
Markets received a boost over the weekend after signs of easing tensions around the Strait of Hormuz, one of the world’s most important oil shipping routes.
Two commercial tankers reportedly transited the waterway on Sunday for the first time since the conflict began, after Iran indicated its shipping restrictions would apply only to vessels linked to its adversaries.
Strategy buys into the bitcoin price game
At the same time, corporate demand for bitcoin continues to expand. Earlier Monday, Strategy, led by Michael Saylor, disclosed the purchase of 22,337 additional bitcoin for approximately $1.57 billion.
The acquisition increased the company’s total holdings to 761,068 BTC, with a combined market value of roughly $50 billion.
Institutional interest is also building internationally. Tokyo-listed investment firm Metaplanet recently secured about $255 million from global investors to accelerate its bitcoin treasury strategy, with additional warrants that could raise total funding to more than $530 million for future purchases.
Despite the rally, market participants remain cautious about declaring a full breakout.
Bitcoin price experienced several rebounds of similar magnitude during the 2022 crypto downturn before eventually falling to cycle lows below $16,000 following the collapse of FTX.
For now, traders are watching whether bitcoin price can maintain support above the $75,000 region. A sustained hold above that level could open the door to a push toward $80,000, which previously acted as a key support zone before the early-2026 correction.
Jack Mallers, CEO of Strike, has recently argued that the current market structure favors long-term accumulation, urging investors to “turn on your DCA,” referring to the dollar-cost averaging strategy of buying Bitcoin prices at regular intervals regardless of price.
According to Mallers, bitcoin price is trading near historically important support zones and prolonged consolidation periods often provide some of the best opportunities to steadily accumulate the asset ahead of major market moves.
Strategy (MSTR), the world’s largest publicly traded holder of bitcoin, continued with its large string of weekly purchases, adding $1.57 billion worth of BTC, according to a Monday filing.
Led by executive chairman Michael Saylor, the company added 22,337 bitcoin at an average price of $70,194 per coin, bringing holdings to 761,068 coins, acquired for $657.61 billion, or an average of $75,696 per coin.
In terms of bitcoin acquired, it was the fifth-largest ever weekly purchase of coins by the company.
Bitcoin was trading at $73,600 on Monday morning, higher by 2.6% over the past 24 hours.
The latest addition to the company’s bitcoin stash was mostly funded via $1.1 billion in sales of the firm’s STRC series of preferred stock. The company also sold $396 million of common stock.
MSTR shares are up 4% in pre-market trading as bitcoin rose through the weekend, currently trading at $73,600, up 2.6% over the past 24 hours.
Law enforcement agencies from the U.S., U.K. and Canada started a joint initiative called Operation Atlantic aimed at disrupting cryptocurrency fraud schemes known as approval-phishing attacks, the Ontario Securities Commission (OSC) said Monday.
The scams work by prompting victims to approve malicious wallet permissions through fake alerts or pop-ups that appear to come from trusted apps or services, the OSC said. Once access is granted, criminals gain control of the wallet and can transfer funds. Because blockchain transactions cannot be reversed, recovery becomes difficult once assets leave a victim’s account.
Cryptocurrency scams generated at least $14 billion in onchain revenue in 2025, according to Chainalysis, with totals expected to climb toward $17 billion as more illicit wallets are identified. Much of the activity now relies on social engineering tactics, complex AI-generated content and phishing-as-a-service platforms to trick victims into granting wallet access or transferring funds.
“Approval phishing and investment scams cost victims millions in financial loss each year,” said Brent Daniels, deputy assistant director for the U.S. Secret Service’s Office of Field Operations, which is involved in the project.
The operation builds on Project Atlas, a 2024 initiative led by the Ontario Provincial Police’s Cyber-Enabled Fraud Team to combat global crypto investment fraud. The project identified over 2,000 compromised wallets across 14 countries, disrupted roughly $70 million in potential fraud, and froze about $24 million in stolen crypto. Similar international efforts, such as Chainalysis’ Operation Spincaster, generated more than 7,000 investigative leads tied to roughly $162 million in losses, highlighting the scale of approval phishing schemes targeting crypto investors.
Authorities said the new operation will help warn potential victims and guide them on securing compromised wallets while attempting to trace and recover stolen funds.
“During Operation Atlantic, the Secret Service, alongside our international law enforcement partners, will identify and disrupt these scams in near real-time denying criminals the ability to further profit from their crimes,” Daniels said.