
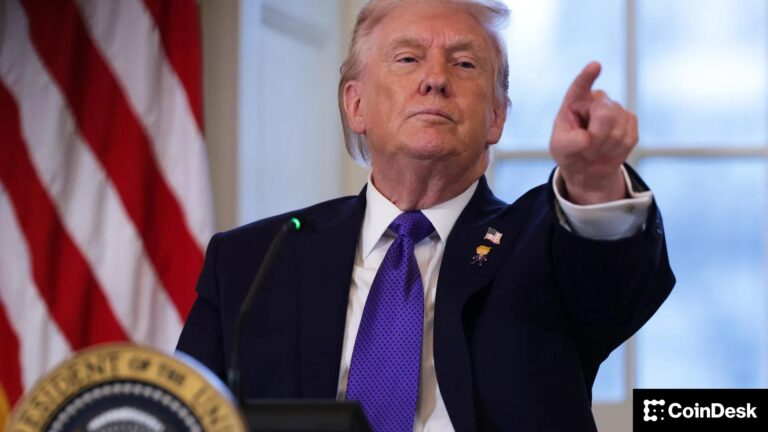
Your day-ahead look for Jan. 20, 2026
Bitcoin slips as ‘Sell America’ trade roars with Trump’s Greenland threats weighing on price – DL News
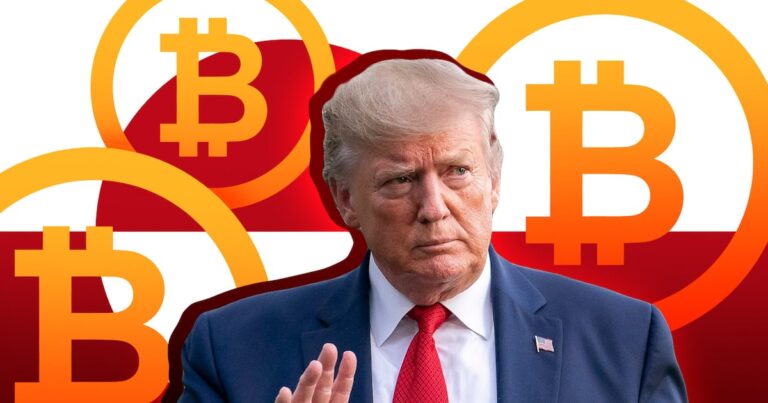
- Bitcoin fell to below $91,000 on Tuesday.
- Analysts warn that it could drop even lower.
- US dollar, stocks, and bonds decline as Trump pursues Greenland.
Bitcoin’s price has slid nearly 5% this week as US President Donald Trump’s pursuit for Greenland revived the “Sell America” trade.
The top crypto plunged below $91,000 on Tuesday as the $3.2 trillion crypto market dropped 2.2%. Now analysts warn that the price could drop to $75,000 — or even lower.
“While markets appear calm on the surface, macro risks are building,” Sean Dawson, research head at Derive.xyz, said in an investor note shared with DL News.
“Rising geopolitical tensions between the US and Europe — particularly around Greenland — raise the risk of a regime shift back into a higher-volatility environment, a dynamic not currently reflected in spot prices,” Dawson said.
Bitcoin’s selloff comes as there is widespread chatter on Wall Street of a “sell America” trade. This is where investors dump US stocks, bonds, and dollars as Trump threatens European allies with tariffs over his campaign to take control of Greenland.
The US dollar slid on Monday, with the euro gaining 0.4 per cent against the US currency.
Bitcoin and altcoins’ price drop on Tuesday would suggest cryptocurrencies are part of that trade.
At the same time, gold, which is seen as a safe haven asset, set a new high of $4,725 per ounce
World leaders have widely condemned Trump’s gambit for the world’s biggest island.
“Tariffs would undermine transatlantic relations and risk a dangerous downward spiral,” European Council President António Costa and Ursula von der Leyen said in a joint statement.
Brussels has also threatened to retaliate against Washington if Trump follows through with his threats.
Traders play defence
Derivatives positioning data shows that traders are anticipating that Bitcoin’s price will drop 17% to $75,000 by June, Dawson said.
“From an options perspective, the outlook remains mildly bearish through mid-year,” he said. “Traders are paying a premium for downside protection.”
“Against a backdrop of persistent geopolitical uncertainty, crypto markets appear more risk-averse than in previous cycles, despite historically low realised volatility,” he said.
Similarly, Bloomberg Intelligence strategist Mike McGlone said that Bitcoin’s inability to hold long-term averages in 2025 is a warning sign that the price could drop as low as $10,000.
To be sure, not everyone is bearish on Bitcoin.
Better macroeconomic conditions and improving economic outlook are now “feeding into crypto,” analysts David Brickell and Chris Mills of the London Crypto Club said in their weekly newsletter.
Bitcoin “acts as the ultimate hedge, given its borderless, decentralised, “safe-haven” characteristics.”
Crypto market movers
- Bitcoin is down 2.3% over the past 24 hours, trading at $90,878.
- Ethereum is down 3.6% past 24 hours at $3,090
What we’re reading
Lance Datskoluo is DL News’ Europe-based markets correspondent. Got a tip? Email at lance@dlnews.com.
Bitcoin is at risk of slide to $58,000 as 'restrictive' Fed policy and trade tensions weigh on crypto

The veteran trader who accurately called the 2018 bitcoin crash has tipped bitcoin to fall to $58,000. Experts said macro conditions favor a bearish bitcoin trend.
BTC Bulls Defend $90K as Hash Ribbons Signal Long-Term Buy Opportunity

Bitcoin’s (BTC) leading indicators flashed buy signals as bulls fought to keep the price above $90,000.
Key takeaways:
-
Bitcoin Hash Ribbons flashed a “buy” signal amid miner capitulation recovery, an occurrence that has historically preceded strong rallies.
-
The Fear and Greed Index’s “golden cross” signals improving market sentiment and a potential BTC rally ahead.
-
Bitcoin must hold $90,000 to avoid a bear market scenario.
Bitcoin Hash Ribbons, sentiment index flash “buy”
Bitcoin miner performance is still telling market participants to buy as sentiment begins to shift across the market.
Hash Ribbons, which measures the 30-day and 60-day moving averages of the hash rate, now says that even current prices represent a “long-term buying opportunity,” according to Capriole Investments.
Related: Bitcoin’s ‘internal conditions’ are improving: Glassnode
The chart below shows that a “buy signal” emerged when the 30-day MA of the hash rate dropped below its 60-day EMA, an occurrence that has historically marked periods of miner capitulation.
This has “often synced with major price discounts and long-term buying opportunities,” Capriole Investments explains on its website.
Researchers at On-Chain Mind made similar observations, saying that Bitcoin is “seeing one of the largest Hash Ribbons signals on record.”
“When miners capitulate and then recover, it often marks the end of forced selling,” On-Chain Mind said in a Jan. 20 post on X, adding:
“Historically, once this phase resolves, it’s been one of the most compelling long-term buy signals.”

Note that the last time Hash Ribbons sent a buy signal was in July 2025, preceding a 25% BTC price rally from $98,000 to its previous all-time high of $123,200.
The Fear and Greed index is also suggesting it’s time to buy Bitcoin as a “golden cross signals a potential rally ahead,” according to data from CryptoQuant.
The chart below is a historical pattern analysis revealing a “bullish sentiment shift as 30-day MA crosses above 90-day MA for the first time since May 2025,” said CryptoQuant analyst MorenoDV_ in a recent Quicktake analysis, adding:
“Historically, these crossovers tend to occur after prolonged fear phases, often near local price compression zones rather than major tops. In most highlighted instances on the chart, price responds positively in the weeks that follow.”

Bitcoin price must hold $90,000
The next important support zone for BTC is at $90,000, a psychological level for the market that the bulls must defend.
The BTC/USD pair is trading within the $90,000–$92,000 range, data from TradingView reveals.
“This area is very important. It has held before, and if the overall bull market is still strong, it needs to hold again,” Crypto Solutions said in an X post on Tuesday, adding:
“As long as $90K holds, buyers are still in control, and another move up is possible.”
This level coincides with the 200-period moving average in the four-hour time frame and the lower boundary of a bear flag, as shown on the weekly chart below.

“If $90K breaks and closes below it on the weekly chart, momentum could turn negative, with a deeper drop toward $80K–$85K,” Crypto Solutions added, referring to a key demand zone on the daily chart.
Lower than that, the April 2025 low at $74,500 and the 200-week MA at $68,000 are key levels to watch on the downside.
The measured target of the bear flag is $57,050, where Bitcoin could bottom in case of an extended downtrend.

As Cointelegraph reported, Bitcoin is at risk of losing $90,000 as macro pressure and weak technicals point to a possible drop toward $80,000 based on a rising-wedge breakdown.
This article does not contain investment advice or recommendations. Every investment and trading move involves risk, and readers should conduct their own research when making a decision. While we strive to provide accurate and timely information, Cointelegraph does not guarantee the accuracy, completeness, or reliability of any information in this article. This article may contain forward-looking statements that are subject to risks and uncertainties. Cointelegraph will not be liable for any loss or damage arising from your reliance on this information.
European carmaker shares slide as Trump threatens new tariffs over Greenland dispute

European car stocks fall after Trump threatens new tariffs over Greenland, with the EU preparing up to €93 billion in retaliatory measures.
Shares of Europe’s largest carmakers fell sharply today after US President Donald Trump pledged to impose new tariffs on several European countries amid a dispute over Greenland.
The Stoxx Automobiles and Parts index was trading about 2% lower on Monday at 2 pm ET after paring steeper losses earlier in the session.
Germany’s Volkswagen, BMW, and Mercedes-Benz Group were down between 2.5% and 3%. Shares of Porsche fell more than 3%.
In Milan, Ferrari slipped about 2.2%, touching a 52-week low, while Stellantis was last seen around 1.8% lower.
The selloff followed Trump’s announcement that the US plans to impose a 10% tariff on imports from the UK, Denmark, Norway, Sweden, France, Germany, the Netherlands, and Finland starting February 1.
Trump said the levy would rise to 25% from June 1. The move is tied to his renewed push to bring Greenland, a self-governing Danish territory, under US control.
In response, European leaders said early Monday the European Union is preparing up to €93 billion in retaliatory tariffs if the US moves ahead with the 10% levy on European countries.
The automotive sector is viewed as particularly vulnerable due to its highly globalized supply chains and heavy reliance on cross-border manufacturing, including significant exposure to North America.
Bermuda partners with Circle and Coinbase to become world’s first fully onchain economy

The Government of Bermuda has announced plans to become the world’s first fully onchain national economy, partnering with Circle and Coinbase to roll out digital asset infrastructure nationwide.
Under the initiative, Circle and Coinbase will equip Bermuda’s government, banks, merchants, and consumers with stablecoin payment tools and enterprise-grade blockchain infrastructure. The plan also includes nationwide digital finance education and onboarding programs.
Premier David Burt framed the move as a natural extension of Bermuda’s leadership in digital asset regulation. The country launched its regulatory framework in 2018 and was one of the first to license both Circle and Coinbase.
Bermudian merchants have already begun accepting USDC for low-cost, fast, dollar-denominated payments, with early pilots reducing transaction fees and supporting local commerce.
The partnership builds on a 2025 airdrop at the Bermuda Digital Finance Forum, where 100 USDC was distributed to each attendee. The 2026 Forum, set for May 11–14, will expand these efforts with broader adoption and a larger stimulus.
Government agencies will pilot stablecoin-based payments, financial institutions will integrate tokenization tools, and residents will participate in digital literacy programs.
“Bermuda has always believed that responsible innovation is best achieved through partnership,” said Premier Burt. “This is about creating opportunity, lowering costs, and ensuring Bermudians benefit from the future of finance.”
Circle CEO Jeremy Allaire called Bermuda a pioneer in blockchain regulation, while Coinbase CEO Brian Armstrong highlighted the country’s clear rules and public-private collaboration as a model for other nations
Trouble mounts for bitcoin and stocks as global benchmark for borrowing costs surges

The 10-year U.S. Treasury yield has climbed to 4.27 percent, a four-month high that raises borrowing costs across the global economy.
Report: RBI Proposes Linking BRICS Central Bank Digital Currencies for Payments
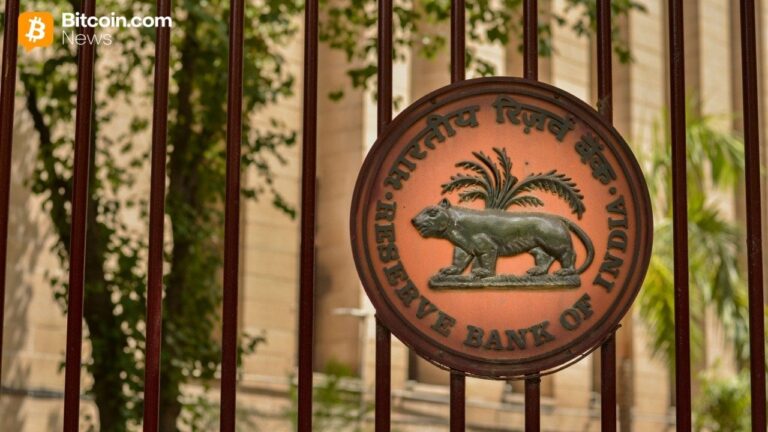
India’s central bank proposes linking BRICS central bank digital currencies to ease cross‑border payments. The Reserve Bank of India reportedly recommended that a proposal to connect central bank digital currencies ( CBDCs) be placed on the agenda for the 2026 BRICS summit in India, aiming to ease cross‑border trade finance and tourism payments among BRICS […]
SEON Launches Identity Verification Built on Real-Time Fraud Intelligence

LONDON AND BARCELONA, January 19, 2025 – SEON, the command centre for real-time fraud prevention and AML compliance, today announced the launch of its AI-powered Identity Verification solution, bringing ID verification, liveness detection and proof of address checks into its unified risk platform.
Unlike traditional tools that only validate documents, SEON’s solution is built on more than 900 real-time fraud signals, helping organisations assess not just whether an ID is real, but whether the person can be confidently approved based on identity and risk signals.
Most identity verification tools focus on validating documents, but lack the risk context needed to determine whether a user meets an organisation’s risk-based requirements. As a result, both high-quality fakes and legitimate documents used by fraudsters can still pass these basic checks. SEON’s Identity Verification solution addresses this gap by combining core KYC checks with live fraud intelligence. This allows teams to filter out low-risk users through onboarding, while filtering out high-risk users before they consume KYC resources.
The solution supports identity document verification for global government-issued IDs, biometric liveness checks, proof of address verification and optional government database checks. Organisations can build verification workflows tailored to customer segment, risk profile or regulatory requirement, combining fraud signals, identity checks and AML screening based on their specific needs. All identity and fraud signals are surfaced in a single dashboard, reducing friction and eliminating silos among fraud, compliance and risk teams.
“Organisations have told us they’re managing separate tools for fraud detection, identity verification and AML compliance – each with its own data, workflows and operational overhead,” said Tamas Kadar, CEO and Co-Founder, SEON. “We built Identity Verification to bring those decisions together. When you combine AI-powered document checks with real-time fraud intelligence, you stop attacks earlier, reduce wasted KYC spend and make faster, more confident approval decisions with a clear audit trail.”
The initial Identity Verification rollout focuses on Europe’s demanding regulatory environment. SEON worked closely with gaming and betting operators to meet strict compliance requirements while maintaining operational efficiency and improving both conversion and fraud outcomes. The solution strengthens SEON’s position across regulated industries including iGaming, fintech and digital platforms.
“The industry is moving toward bringing identity verification, fraud and AML into one decision layer, and SEON is helping to lead that shift,” said Filip Gvardijan, Head of Fraud Prevention at industry leading operator, Superbet. “That shift matters. It cuts out pointless and expensive KYC cycles on users who were never legitimate, and also clears a faster path for legitimate users, removing a huge amount of avoidable and often manual work.”
About SEON
SEON is the command centre for real-time fraud prevention and AML compliance, helping thousands of companies worldwide stop fraud, reduce risk and protect revenue. Powered by 900+ real-time, first-party data signals, SEON enriches customer profiles, flags suspicious behavior and streamlines compliance workflows. With integrated fraud and AML capabilities, SEON operates globally from Austin, London, Budapest and Singapore. Learn more at seon.io.
Chinese crime ring arrested in South Korea laundered over $100 million worth of crypto

South Korean customs officials said they arrested three China nationals and have referred them for prosecution. They allegedly used an unauthorized crypto exchange to launder assets.