Trusted Editorial content, reviewed by leading industry experts and seasoned editors. Ad Disclosure
Bitcoin (BTC) has just formed a textbook inverse Head & Shoulders pattern, signaling the beginning of a potential shift in its market structure. Despite the broader market selloff that pushed the cryptocurrency below $70,000, a crypto analyst suggests that the newly formed pattern indicates that a fresh bullish trend could be up ahead.
Bitcoin Head & Shoulder Pattern Signals Price Reversal
In an X post this Thursday, market analyst Crypto Tice declared that Bitcoin has printed a classic inverse Head & Shoulders pattern on its chart, renewing the debate over whether the market is on the verge of another historic breakout. He said that this pattern is a textbook structural signal that has formed over an extended period on the weekly timeframe.
Related Reading: Bitcoin Historical Performance Shows How Low The Price Will Go Before A Bottom
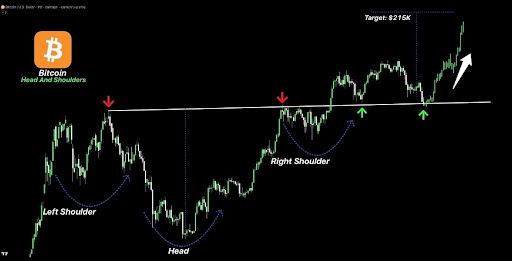
The chart highlights three distinct phases in Bitcoin’s price action, showing how the inverse Head and Shoulder pattern formed. The first stage saw a “Left Shoulder” emerge after an initial rally, followed by a deep decline that shaped the head of the Head and Shoulders pattern. Subsequently, prices climbed again to create a higher “Right Shoulder,” signaling that sellers were losing momentum while bulls were gradually asserting control.
A horizontal line across the previous swing highs on the price chart marks the neckline of the inverse Head and Shoulders pattern, which Crypto Tice highlights as a pivotal level for determining Bitcoin’s next major trend. According to him, Bitcoin is currently retesting this trendline, as a breakout from here could set the stage for a potential price rally.
Source: Chart from Crypto Tice on X
Crypto Tice highlighted that the current retest should not be seen as a sign of weakness, but as confirmation that Bitcoin’s structure is still holding. He said that market sentiment at this stage often wavers among investors and traders. However, historical trends suggest that similar retests have preceded major price expansions.
Crypto Tice noted that the inverse Head and Shoulder pattern is a critical signal that often signals a transition from accumulation to expansion. Historically, accumulation phases allow buying pressure to build, followed by a breakout, a controlled pullback, and finally a retest confirmation.
Head & Shoulder Pattern Point To $215,000 Price Target
Above the neckline of Bitcoin’s Head & Shoulder pattern, Crypto Tice has set a projected target of $215,000 on the chart, indicating where the market could move if BTC breaks out decisively. With the cryptocurrency currently trading above $65,000, this would represent a roughly 231% increase.
Related Reading: Did Satoshi Nakamoto Sell 10,000 Bitcoin For $800 Million? Here’s The Truth
Given the recent market downtrend and Bitcoin’s price breakdown below $70,000, the analyst acknowledged that a sudden move to $200,000 sounds largely unrealistic. However, he noted that the same perception was held in past cycles before Bitcoin skyrocketed to new all-time highs against the odds. Concluding his analysis, Crypto Tice explained that large price trends rarely begin comfortably, noting that they typically emerge amid market hesitation and uncertainty.
BTC trading at $65,881 on the 1D chart | Source: BTCUSDT on Tradingview.com
Featured image from Pngtree chart from Tradingview.com
Editorial Process for bitcoinist is centered on delivering thoroughly researched, accurate, and unbiased content. We uphold strict sourcing standards, and each page undergoes diligent review by our team of top technology experts and seasoned editors. This process ensures the integrity, relevance, and value of our content for our readers.
Bitcoin’s derivatives signal caution, with the options skew hitting 20% as traders fear another wave of fund liquidations.
Bitcoin price recovered some of its Thursday losses, but it still struggles to match the gains of gold or tech stocks amid low leverage demand.
Bitcoin (BTC) has gained 17% since the $60,150 low on Friday, but derivatives metrics suggest caution as demand for upside price exposure near $70,000 remains constrained. Traders fear that the liquidations of $1.8 billion of leveraged bullish futures contracts in five days indicate that major hedge funds or market makers may have blown up.
Aggregate liquidations in Bitcoin futures contracts, USD. Source: CoinGlass
Unlike the Oct. 10, 2025, market collapse that culminated with a record $4.65 billion liquidation of Bitcoin futures, the recent price weakness has been marked by three consecutive weeks of downside pressure. Bulls have been adding positions from $70,000 to $90,000, as aggregate futures open interest increased despite forceful contract liquidations due to insufficient margins.
Bitcoin futures aggregate open interest, BTC. Source: CoinGlass
The aggregated Bitcoin futures open interest on major exchanges totaled 527,850 BTC on Friday, virtually flat from the prior week. Although the notional value of those contracts dropped to $35.8 billion from $44.3 billion, the 20% change perfectly reflects the 21% Bitcoin price decline in the seven-day period. Data indicates that bulls have been adding positions despite the steady price decline.
To better understand if whales and market makers have turned bullish, one should assess the BTC futures basis rate, which measures the price difference relative to regular spot contracts. Under neutral circumstances, the premium should range from 5% to 10% annualized to compensate for the longer settlement period.
The BTC futures basis rate dropped to 2% on Friday, the lowest level in more than a year. The lack of demand for bullish leverage is somewhat expected, but bulls will take longer than users to regain confidence even as Bitcoin price breaks above $70,000, especially considering that BTC is still 44% below its all-time high.
Bitcoin derivatives metrics signal extreme fear
Traders’ lack of conviction in Bitcoin is also evident in the BTC options markets. Excessive demand for put (sell) options is a strong indicator of bearishness, pushing the skew metric above 6%. Conversely, when fear of missing out kicks in, traders will pay a premium for call (buy) options, causing the skew metric to flip negative.
BTC two-month options skew (put-call) at Deribit. Source: laevitas.ch
The BTC options skew metric reached 20% on Friday, a level that rarely persists and typically represents market panic. For comparison, the skew indicator stood at 11% on Nov. 21, 2025, following a 28% price correction to $80,620 from the $111,177 peak reached 20 days earlier. Since there is no specific catalyst for the current downturn, fear and uncertainty have naturally intensified.
Related: What’s really weighing on Bitcoin? Samson Mow breaks it down
Traders are likely to continue speculating that a major market maker, exchange or hedge fund may have gone bankrupt, and this sentiment erodes conviction and implies a high probability of further price downside. Consequently, the odds of sustained bullish momentum remain low while BTC derivatives metrics continue to signal extreme fear.
This article does not contain investment advice or recommendations. Every investment and trading move involves risk, and readers should conduct their own research when making a decision. While we strive to provide accurate and timely information, Cointelegraph does not guarantee the accuracy, completeness, or reliability of any information in this article. This article may contain forward-looking statements that are subject to risks and uncertainties. Cointelegraph will not be liable for any loss or damage arising from your reliance on this information.
Cryptocurrency markets experienced a brutal sell-off this week as investor concerns grew over stagnating US liquidity following US President Donald Trump’s nomination of Kevin Warsh to lead the Federal Reserve.
Bitcoin exchange-traded funds (ETFs) recorded three consecutive days of outflows, with $431 million exiting on Thursday, according to data from Farside Investors. Bitcoin’s (BTC) price briefly dipped to $60,074 on Friday before recovering above $64,930 as of 7:49 a.m. UTC.
Warsh — who previously served as a Fed governor from 2006 to 2011 — is expected to continue the interest rate cut trajectory. His nomination may also signal that broader market liquidity is expected to “stabilize rather than meaningfully expand,” Thomas Perfumo, economist at crypto exchange Kraken, told Cointelegraph.
The industry recorded its 10th-largest liquidation event on Jan. 31, as more than $2.56 billion in leveraged positions were wiped out, according to derivatives data platform CoinGlass.
Top 10 largest liquidation events in crypto history. Source: Coinglass
Blockchain intelligence platform TRM Labs completed a $70 million Series C funding round, valuing it at $1 billion, becoming the latest crypto company to reach unicorn status.
The investment round was led by seed investor Blockchain Capital, with participation from Goldman Sachs, Bessemer Venture Partners, Brevan Howard Digital, Thoma Bravo, Citi Ventures and Galaxy Ventures, according to a Wednesday news release.
TRM Labs seeks to equip public and private institutions with AI solutions that combat cybercrime. The company defends against illicit activities that increasingly rely on automation.
“At TRM, we’re building AI for problems that have real consequences for public safety, financial integrity, and national security,” wrote Esteban Castaño, co-founder and CEO of TRM Labs.
“This funding allows our world-class team — and the people who will join us next — to innovate alongside institutions on the front lines of the most consequential threats, and expand the potential of AI to meaningfully improve how our critical systems are protected.”
The $70 million round shows that capital is flowing into blockchain analytics platforms seeking to stop the spread of AI-fueled scams and cyberattacks, including from large traditional institutions.
Continue reading
Avalanche tokenization hits Q4 high as BlackRock’s BUIDL expands onchain
Blockchain network Avalanche saw increasing institutional adoption across tokenized money market funds, loans and indexes in the fourth quarter, driving the value of real-world assets (RWAs) on the layer 1 to a new high.
The total value locked of tokenized RWAs on Avalanche rose 68.6% over the fourth quarter of 2025 and nearly 950% over the year to more than $1.3 billion, boosted by the $500 million BlackRock USD Institutional Digital Liquidity Fund (BUIDL) that launched in November, Messari research analyst Youssef Haidar said in a Jan. 29 report.
Fortune 500 fintech FIS partnered with Avalanche-based marketplace Intain to launch tokenized loans in November, further boosting Avalanche’s TVL, Haidar said. Intain enables 2,000 US banks to securitize over $6 billion worth of loans on Avalanche.
The S&P Dow Jones also partnered with Dinari, an Avalanche-powered blockchain, to launch the S&P Digital Markets 50 Index, which tracks 35 crypto-linked stocks and 15 crypto tokens on Avalanche.
Change in Avalanche real-world asset tokenization over the last 12 months. Source: Messari
Traditional finance firms are increasingly confident about experimenting with tokenization, as the Securities and Exchange Commission has become more open to crypto products over the past year.
Continue reading
ParaFi Capital makes $35M investment in Solana-based Jupiter
Jupiter said it has secured a $35 million strategic investment from ParaFi Capital, marking the first time the Solana-based onchain trading and liquidity aggregation protocol has taken outside capital after years of bootstrapped growth.
The transaction involved token purchases at market prices with no discount and an extended lockup period and was settled entirely in Jupiter’s JupUSD stablecoin, the companies said. Financial terms beyond the $35 million investment were not disclosed.
Source: Jupiter
The investment comes as Jupiter has processed more than $1 trillion in trading volume over the past year and expanded beyond swap routing into perpetuals, lending and stablecoins, according to the company.
The deal also included warrants allowing ParaFi Capital to acquire additional tokens at higher prices, a structure the companies said was intended to reflect long-term alignment.
The investment follows a recent expansion of Jupiter’s product offerings. In October, Jupiter rolled out a beta version of its onchain prediction market developed with Kalshi, followed in January by the launch of JupUSD, a Solana-native, dollar-pegged stablecoin built in partnership with Ethena Labs.
Jupiter’s native token (JUP) was up around 9% over the past 24 hours, according to CoinGecko data.
Source: CoinGecko
Continue reading
Aave winds down Avara, phases out Family wallet in DeFi refocus
Aave Labs said it is sunsetting its “umbrella brand” Avara in the company’s latest move to refocus on decentralized finance and simplify its branding.
Aave founder and CEO Stani Kulechov posted Tuesday on X that Avara, a company encompassing projects including the Family crypto wallet and previously the social media platform Lens, “is no longer required as we go all in on bringing Aave to the masses.”
Kulechov said the Apple iOS-based Family crypto wallet was also being wound down as the team has “learned that onboarding millions of users requires purpose-built experiences, such as savings, rather than generic, open-ended wallet experiences.”
The move marks Aave’s latest effort to refocus on products such as its flagship lending protocol as the project handed stewardship of Lens to the Mask Network last month, with Kulechov saying Aave’s participation in the protocol would be reduced to an advisory role so it can focus on DeFi.
Source: Stani Kulechov
Kulechov said in his latest post that Aave was “now united as one team of world-class designers, engineers, and smart contract experts, aligned around a single mission: bringing DeFi to everyone.”
Continue reading
Step Finance treasury wallets breached, $27M in SOL drained as STEP crashes 90%
Step Finance, a decentralized finance portfolio tracker on Solana, disclosed a security breach that led to the compromise of several treasury wallets, triggering a sharp sell-off in its native token.
“Earlier today, several of our treasury wallets were compromised by a sophisticated actor during APAC hours. This was an attack facilitated through a well-known attack vector,” the platform wrote in a post on X, adding that they have taken “remediation” steps.
Onchain data reviewed by blockchain security firm CertiK shows that roughly 261,854 Solana (SOL) (worth around $27.2 million) was unstaked and transferred from Step Finance-controlled wallets.
Step Finance has not yet confirmed the total scale of the losses. The team also did not disclose how the attacker gained access, nor whether the incident stemmed from a smart contract flaw, compromised keys or an internal access issue. It also remains unclear whether any user funds were affected, beyond protocol-owned assets.
The compromised transaction. Source: Certik
Continue reading
DeFi market overview
According to data from Cointelegraph Markets Pro and TradingView, most of the 100 largest cryptocurrencies by market capitalization ended the week in the red.
The privacy-preserving Zcash (ZEC) token fell 35% to record the week’s biggest decline in the top 100, followed by the Story (IP) token, down 34% during the past week.
Total value locked in DeFi. Source: DefiLlama
Thanks for reading our summary of this week’s most impactful DeFi developments. Join us next Friday for more stories, insights and education regarding this dynamically advancing space.
Ethereum traded above the $2,000 per coin range on Friday afternoon, as derivatives markets flashed a mix of caution and crowding across futures and options. Futures open interest edged lower intraday while options data showed traders clustering around key strikes, setting the stage for potential price compression. Ethereum Options Positioning Points to Compression Near Max […]
New product detects costly human-driven fraud and abuse that existing tools catch too late
Kasada today announced Account Intelligence, a new product designed to detect account-level fraud and abuse. The goal is to prevent repeat abuse before it creates financial loss and unnecessary friction for real customers.
“Teams already know what this kind of fraud and abuse looks like,” said Sam Crowther, Founder and CEO of Kasada. “What they’ve been missing is a way to see it early.”Share
Enterprises are facing account and business-logic abuse that existing bot and fraud tools were never built to detect. In a single session, this human-driven activity often looks legitimate. Risk only becomes clear later, after damage has already occurred.
“Teams already know what this kind of fraud and abuse looks like,” said Sam Crowther, Founder and CEO of Kasada. “What they’ve been missing is a way to see it early.”
Closing the gap in early fraud detection
Account Intelligence was developed in response to customer demand. Teams already using Kasada asked for a way to extend protection to address manual fraud and abuse.
Early customers are using Account Intelligence for high-impact use cases, such as:
account takeover and credential abuse
guest checkout abuse
promo abuse and loyalty fraud
refund and return abuse
reseller and multi-account fraud
coordinated fraud across multiple identities
How Account Intelligence works
Most fraud solutions are focused on the payment layer and rely on behavioral signals that can be spoofed or replayed. Account Intelligence takes a different approach.
“We’re using high-fidelity device telemetry that’s hard to fake, and tying it to account behavior over time,” Crowther added. “That’s how we catch abuse when it happens.”
The product provides real-time insight into account risk and links activity across devices and sessions. This reduces fraud losses and improves the customer experience.
Kasada observes activity from 170 million people every day across its customer base. This scale helps establish baseline behavior and makes repeat abuse easier to recognize when fraudsters reappear across accounts.
Account Intelligence is the next layer in Kasada’s evolution into a broader fraud prevention platform. By combining automation defense with account continuity, Kasada enables brands to stop fraud and abuse earlier before it surfaces downstream.
XRP staged a sharp rebound on Friday, rising about 18% over 24 hours to trade near $1.49 after a deep selloff a day earlier made it the worst performer among major tokens.
The move came as bitcoin briefly rose over $70,000 in U.S. morning hours, reversing Thursday’s sharp declines ahead of the weekend.
The bounce came after XRP collapsed to roughly $1.14 in the prior session, a move that triggered heavy liquidations and flushed out traders who had been leaning too hard on leverage.
Data shows short liquidations of roughly $26 million in the past 24 hours, compared with around $30 million in longs from earlier Thursday.
That imbalance matters. It suggests the market wasn’t reacting to fresh bad news as much as it was mechanically clearing out bullish bets as prices slid. Once those positions were forced shut, selling pressure eased and XRP was able to rebound quickly.
The recovery also comes at an awkward time for XRP’s broader narrative. Ripple and its ecosystem have spent the past week pitching a more institutional future for the XRP Ledger, including plans for permissioned markets, lending and privacy tools.
Flare, a closely watched project trying to bring DeFi-style utility to XRP through FXRP, also expanded institutional access through custody firm Hex Trust.
But none of that helped XRP sentiment when the market cracked.
Friday’s rally, then, looks less like investors suddenly buying into the “institutional DeFi” pitch and more like a classic crypto snapback: a steep fall, a leverage wipeout, then a fast rebound once forced sellers are gone.
Meanwhile, a ratio of bullish versus bearish bets on futures tracking XRP shows retail longs got rinsed, but big traders were leaning the other way.
On Binance, the overall account-based long/short ratio is 2.13 as of Friday, meaning there were about 2x more accounts positioned long than short. That’s usually a sign of crowded bullish positioning — lots of smaller traders expecting a bounce.
But at the same time, Binance’s top trader long/short (positions) is ~0.73, which means the biggest traders on Binance were net short.
That split suggests XRP’s dump wasn’t random: it likely ran into a market where smaller traders were stubbornly long, while larger players were positioned to profit from a flush.
And once those longs were cleared, XRP did what it usually does after a wipeout: it snapped back violently, because there wasn’t much selling left.
This content is provided by a sponsor. PRESS RELEASE. Victoria, Seychelles, February 6, 2026 — Bitget, the world’s largest Universal Exchange (UEX), today announced the launch of the Bitget Fan Club, a new community initiative designed to bring users closer into the platform’s growth journey through structured participation, product collaboration, and content-driven engagement. The Bitget […]
Russia’s largest bank, Sberbank, is moving toward offering loans secured by cryptocurrency and said Friday it is prepared to coordinate with the country’s central bank on shaping the necessary regulatory framework, according to Reuters.
The lender has already tested the model in January. The bank issued the country’s first bitcoin-backed loan to one of its largest bitcoin miners, IntelionData, calling the transaction a pilot and suggesting it was keen to issue more in the future.
The volume of digital financial asset issuances on the platform hit 408 billion rubles (about $5.3 billion) in 2025 — an increase of 5.6 times versus 2024 (73 billion rubles, or $948 million) and 204 times greater than 2023 (2 billion rubles or $26 million).
Sberbank’s regulated digital financial asset (DFA) business expanded rapidly in 2025, with total issuance reaching RUB 408 billion ($4.9 billion), more than 5.6 times the 2024 level, while the bank’s own DFA holdings grew sevenfold in six months to RUB 185 billion ($2.2 billion).
The growth comes alongside a still-dominant traditional balance sheet: in December, Sber’s corporate loan portfolio stood at RUB 30.4 trillion ($365 billion), its retail loan book at RUB 18.8 trillion ($226 billion), and client deposits at RUB 33.1 trillion ($398 billion), highlighting the relatively small but fast-scaling role of tokenized assets within Russia’s largest lender.
When announcing the trial loan, Anatoly Popov, Sberbank’s deputy chairman, said the bank already offers clients structured bonds and digital financial assets with investments in bitcoin and ether. Popov also said the bank was currently testing decentralized finance (DeFi) instruments and supports the gradual legalization of cryptocurrencies within the Russian legal framework.
Another major lender, Sovcombank, became the first Russian bank to roll out crypto-backed lending on Feb. 5 to individuals and businesses legally holding bitcoin.
In December 2025, it reopened the cryptocurrency market to the public with new rules laid out by the country’s central bank. Officials expect to complete legislation governing crypto assets by July 1, 2026.
Sberbank said the planned lending program would target not only mining companies but also businesses that hold cryptocurrency on their balance sheets.
XRP is rebounding sharply as crypto risk appetite returns, according to a new analysis highlighting heavy whale accumulation and surging network activity that signal renewed momentum after a steep sell-off, positioning the token as a market standout. XRP Rebound Gains Strength as Whales and Network Activity Surge At 4:12 p.m. on Feb. 6, XRP is […]
The People’s Bank of China (PBOC), the country’s central bank, and seven Chinese regulatory agencies published a joint statement on Friday banning the unapproved issuance of Renminbi-pegged stablecoins and tokenized real-world assets (RWAs).
The ban applies to both domestic and foreign stablecoin and tokenized RWA issuers, according to the statement, which was also signed by the Ministry of Industry and Information Technology and China’s Securities Regulatory Commission. A translation of the announcement said:
“Stablecoins pegged to fiat currencies perform some of the functions of fiat currencies in disguise during circulation and use. No unit or individual at home or abroad may issue RMB-linked stablecoins without the consent of relevant departments.”
Winston Ma, an adjunct professor at New York University (NYU) Law School and former Managing Director of CIC, China’s sovereign wealth fund, told Cointelegraph that the ban extends to the onshore and offshore versions of China’s Renminbi, also called the yuan.
“The Beijing crypto ban rule applies across all RMB-related markets, whether CNH or CNY,” he said. CNH is the offshore version of the Renminbi, designed to give the currency flexibility in foreign exchange markets, without sacrificing currency controls, Ma said.
“This is the latest step in a multi‑year project: Keep speculative crypto outside the formal financial system, while actively promoting the usage of e-CNY, the sovereign CBDC issued by China’s central bank,” he said.
The structure of the digital yuan, China’s CBDC. Sources: Cointelegraph
The announcement follows the Chinese government approving commercial banks to share interest with clients holding the country’s digital yuan, a central bank digital currency (CBDC) managed by state authorities.
Related: China’s interest-bearing digital yuan piles pressure on US stablecoin rules
Chinese government briefly considered yuan-pegged stables, but focused on CBDC instead
In August 2025, reports began circulating that China’s government was considering allowing private companies to issue yuan-pegged stablecoins, a major reversal of long-standing policy.
However, the Chinese government restricted stablecoin and digital asset issuance in September of that same year, instructing stablecoin issuers to pause or halt their stablecoin trials until further notice.
In January 2026, the PBOC approved commercial banks paying interest to digital yuan wallets in a push to make the CBDC more attractive to investors.
Magazine: China officially hates stablecoins, DBS trades Bitcoin options: Asia Express
Cointelegraph is committed to independent, transparent journalism. This news article is produced in accordance with Cointelegraph’s Editorial Policy and aims to provide accurate and timely information. Readers are encouraged to verify information independently. Read our Editorial Policy https://cointelegraph.com/editorial-policy