
Home Blog Page 1046

$84K Support Broken, Price Eyes $68K–$60K Zone

0

Bitcoin Price Weekly Outlook

Last week, we were expecting the critical $84,000 support level to break, and to the bulls’ dismay, it did. Bitcoin had a small bounce after the prior week’s close, then proceeded to dump down through the $84,000 support level all the way down to $75,600 on Saturday, before moving up a little to close the week out at $76,919. Bitcoin dropped 13% last week, so we may see a bounce early this week back to $80,000 or so, but continuation downwards should be expected before too long.

Key Support and Resistance Levels Now

The bulls are reeling this week after losing that key $84,000 support level. We are seeing a little bit of a bounce early on here, but the bulls will be hard-pressed to regain much ground. $79,000 should serve as resistance early on here, with $81,000 sitting as the next resistance above. Now that $84,000 has broken as support, it should be strong resistance on the way back up. $87,600 at the POC on the volume profile should be a brick wall of resistance if the bitcoin price can manage to wick above $84,000.

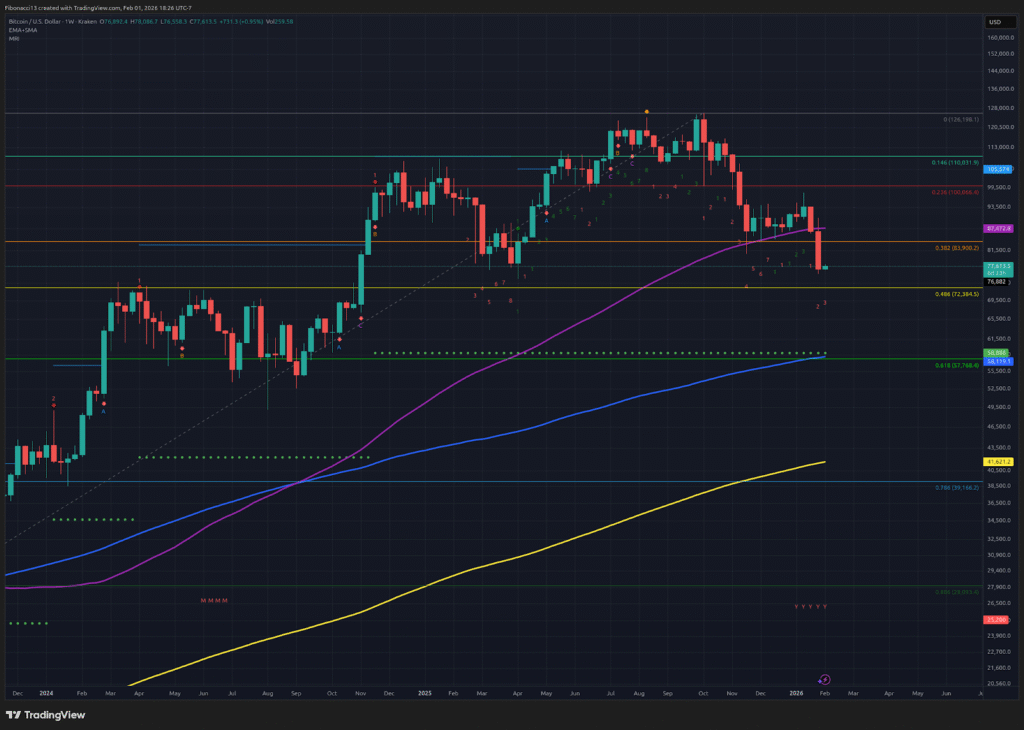
The bears are now sitting comfortably in control. The price bounced from $75,600, so we will look to this level initially as support, but don’t expect it to hold up if under pressure. Below $75,000, we will look at $72,000 all the way down to $68,000 as a support zone. A solid bounce from this level is warranted with all the volume that built up there in the 2024 consolidation period. Losing $67,000 below this support opens up the door to $58,000 at the 0.618 Fibonacci retracement. $42,000 sits as support below here, but don’t expect to see it anytime soon.

Outlook For This Week

Zooming into the daily chart, we see that the RSI has hit oversold levels over the last few days. The bulls should try to muster a small push back up soon. Bitcoin price will likely look to continue the push down to at least $72,000 here before mustering a bounce. When and if the bounce comes, it should try to tag the $79,000 resistance at least, and possibly even $81,000, but don’t expect more than that.
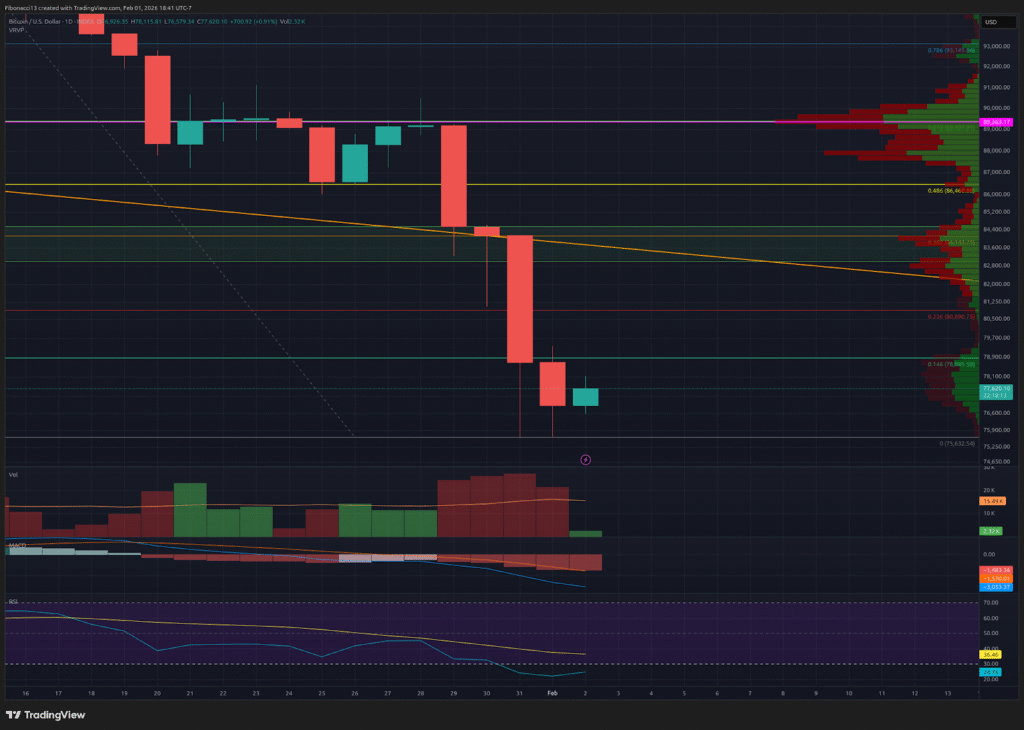
Market mood: Extremely Bearish – The bears finally busted down the door at the $84,000 support level. They will look to carry this momentum forward as the bewildered bulls seek out where to make their stand.

The next few weeks
At this point, even the most stubborn of bulls must concede that we are indeed in a long-term bear market. Losing the 100-week SMA, which had been support for several weeks, was a big sign of strength for the bears. Expect the bitcoin price to remain below $87,600 until a long term bottom is in place here. There is a high volume node from $68,000 down to $60,000, so expect the price to take its time moving around this area if $68,000 is lost as support.
Terminology Guide: Bitcoin Price Weekly Outlook

Bulls/Bullish: Buyers or investors expecting the price to go higher.

Bears/Bearish: Sellers or investors expecting the price to go lower.

Support or support level: A level at which the price should hold for the asset, at least initially. The more touches on support, the weaker it gets and the more likely it is to fail to hold the price.

Resistance or resistance level: Opposite of support.  The level that is likely to reject the price, at least initially. The more touches at resistance, the weaker it gets and the more likely it is to fail to hold back the price.

SMA: Simple Moving Average. Average price based on closing prices over the specified period. In the case of RSI, it is the average strength index value over the specified period.

Oscillators: Technical indicators that vary over time, but typically remain within a band between set levels. Thus, they oscillate between a low level (typically representing oversold conditions) and a high level (typically representing overbought conditions). E.G., Relative Strength Index (RSI) and Moving Average Convergence-Divergence (MACD).

RSI Oscillator: The Relative Strength Index is a momentum oscillator that moves between 0 and 100. It measures the speed of the price and changes in the speed of the price movements. When RSI is over 70, it is considered to be overbought. When RSI is below 30, it is considered to be oversold.

Volume Profile: An indicator that displays the total volume of buys and sells at specific price levels. The point of control (or POC) is a horizontal line on this indicator that shows us the price level at which the highest volume of transactions occurred.

High Volume Node: An area in the price where a large amount of buying and selling occurred. These are price areas that have had a high volume of transactions and we would expect them to act as support when price is above and resistance when price is below.

Fibonacci Retracements and Extensions: Ratios based on what is known as the golden ratio, a universal ratio pertaining to growth and decay cycles in nature. The golden ratio is based on the constants Phi (1.618) and phi (0.618).
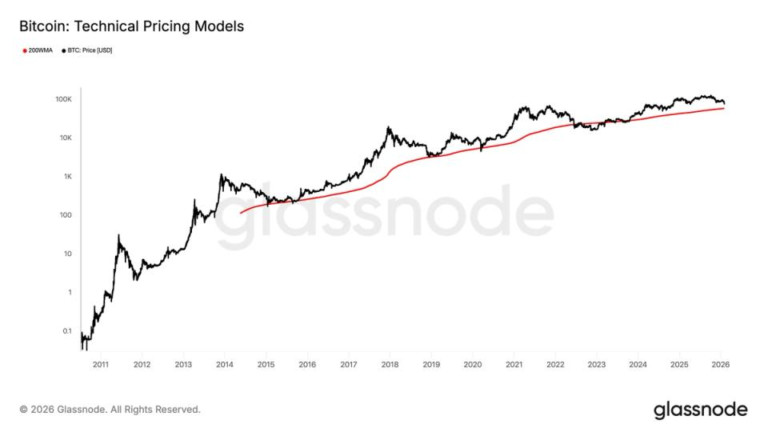

Bitcoin has a line in the sand that has saved every bull market since 2015

0

Bitcoin’s 11% slide last week may be the least of investors’ concerns. It’s a price of around $58,000, another 25% below current levels, they should be paying attention to.

While the largest cryptocurrency’s recent crash, the biggest weekly drop since March 2025, and inability to attract buyers has many holders worried about another so-called crypto winter, there’s still a painful journey before it reaches the possible silver lining that is the 200-week moving average (WMA).

The mean closing price of BTC over the past 200 weeks is a widely used long-term momentum indicator and a baseline for the traditional-four year bitcoin cycle. It has marked a market bottom in every previous cycle, and is currently at $57,926.

Historically, bitcoin has often peaked in the fourth quarter of the fourth cycle year. This time round, it reached an all-time high of $126,000 in October and is currently down around 40% from that peak.

A further slide may be on the cards.

Last week’s drop took bitcoin below the Ichimoku Cloud, a technical indicator that gauges momentum, support and resistance. When the price holds above the cloud, that indicates a robust bullish trend, with strong upward momentum. When price falls below it, the market turns anemic, lacking strength and exposed to extended weakness, like a human body that’s short of iron.

Bitcoin just crossed below the cloud on the weekly chart, a bearish shift that’s historically signaled the start of the deepest and most painful bear-market phases.

TradingView

It also appears to be broadly tracking the four-year cycle theory, driven by the halving schedule that cuts new supply by 50% roughly every four years and is partially the reason for the cyclical bull and bear markets.

In the 2015 bear market, bitcoin traded slightly above $200 and consistently used the 200-WMA as support. During the 2018-2019 bear market, the 200-WMA sat just above $3,000 and again acted as support, with a brief breakdown during the Covid-driven market crash in March 2020.

In the previous cycle, bitcoin fell below the 200-WMA in June 2022, to levels below $22,000, and remained there for an extended period. The price did not reclaim the 200-WMA line until October 2023, confirming its role as a long-term trend support line.

While there’s no guarantee, the recent price drop below the Ichimoku Cloud indicates another sustained bear-market phase may be imminent, but at least there’s a time-proven support level to provide some cheer.

UPDATE (Feb. 2, 16:55 UTC): Rewrites headline

Opera (OPRA) shares surge after company’s MiniPay adds USDT

0

Browser maker Opera’s (OPRA) shares surged more than 15% after the opening bell after the company announced it’s expanding support for Tether’s USDT stablecoin and tether gold (XAUT0) in its self-custodial crypto wallet MiniPay.

The move brings broader access to dollar-backed and gold-backed cryptocurrencies for millions of users in emerging markets.

Shares of Opera slid over the past week to a $12.40 low before the announcement helped them rise to $14.65. MiniPay, which the company says has 12.6 million activated wallets, will now allow users to use these tokens “without navigating the complexities of the blockchain.”

The wallet, which boasts more than 3.64 million onchain users, processed over $153 million in stablecoin transactions in December alone, according to Opera.

MiniPay is not a financial service itself but connects users to on- and off-ramp providers like Binance, Partna and Fonbank, helping bridge fiat and crypto economies. Last year, the company rolled out a “Pay like a local” feature, allowing users to pay in Argentina using Mercado Pago and in Brazil using Pix, the instant payment systems of each country

Since then, the feature has expanded to include instant SEPA payments in Europe and instant bank transfers in Nigeria.

Tether earlier this month reported it made over $10 billion in net profit for 2025, driven by the growth in its USDT stablecoin and its underlying U.S. Treasury holdings. The firm has been buying up to $1 billion of gold per month as it bets on the precious metal alongside BTC.

Combatting Cultural Bias in the Translation of AI Models

0

While AI bias has most often been the systemic bias large language models sometimes display against different genders and races, it is also becoming clear that models can be biased by a preference for one language over another.

In recent years, efforts have been made to curb this preference, with AI model developers such as Google and OpenAI creating translation models. Most recently, Google released TranslateGemma on Jan. 15, which was trained in 55 languages and 500 language pairs — languages that can easily be translated from one to the other.

However, translation models fail to capture some of the nuances of spoken language. Enterprise AI platform vendor Articul8 says its LLM-IQ agent provides more insight into this. The multi-tiered evaluation agentic system scores models on five qualitative dimensions: fluency and naturalness, coherence, cultural norms, consistency and clarity.

With the framework, Articul8 found that many models failed on cultural appropriateness, suggesting that more work is needed for AI technology to be ready on a global scale.

Related:Anthropic Aims for Transparency With Claude Constitution

In this Q&A, Articul8 CEO and founder Arun Subramaniyan discusses what led to the development of the framework and why having a culturally appropriate model is essential.

What led Articul8 to develop the LLM-IQ agent, and why did it focus on the nuances of translation in AI models?

Arun Subramaniyan: We have customers in Japan and in Korea. As we started deploying into those regions, we needed models that actually understood multiple languages.

One thing that happened was that when we deployed some of our systems early on, the customer was both happy and unhappy. 

In Japan and Korea, they told us, “Your answer is accurate, but it’s rude.” 

We said, ‘Okay,’ but we didn’t know the difference. 

It so turns out that Japanese has multiple layers of complexity. A lot of languages have that. For example, in English, you is only you. It’s neither respectful nor disrespectful. Whereas in many languages there is a ‘you’ for people you’re on the same level with, if you’re addressing elders, seniors, or someone with respect, it’s a different word. And those nuances are sometimes picked up, but most of the time they are not. 

But in Japanese, there is one more level where the context of what you are saying, like who you are saying it to, who is saying it, and to get what outcome from that conversation. You can be direct, indirect, polite, overly polite, or slightly harsh. Depending on the context, if you use the wrong, say, intonation, that’s also considered wrong.

Related:Opinion: Work With – Not Against – Shadow AI

That’s really what intrigued us, because this is more at the linguistic level. Even though it is not a technical domain, it is a domain-specific language for Japanese.

After we did more research, we found it to be very systematic. All of the models were built predominantly with English or Latin-like languages, and even those from China missed this nuance completely. Their representation of Japanese in terms of digital content might be higher. However, they were not trained to catch these nuances. 

In what situations would it matter whether an LLM is polite or impolite?

Subramaniyan: For example, in a supply chain, you don’t know whether somebody was giving a recommendation or whether somebody gave a directive that will have profound implications.

Also, it might have serious costs.

If you have an automotive system, it is generating a recommendation. The human in the loop is reading the recommendation. The human doesn’t know whether the recommendation needs to be acted on with 100% certainty. That has profound implications in an industrial setting. 

With the rise of sovereign AI, with more regional AI vendors addressing local issues with their own technology, why should a vendor outside a country like Japan be the one to deal with the language problem?

Related:Responsible AI Center to Combine Research With Industry Know-How

Subramaniyan: I see this more as someone with global insight versus somebody with only local insight. You need to be locally enabled, but globally optimistic. 

It’s about global learning applied immediately in Japan, with localization that is uniquely Japanese. It’s very different because, yes, you know more about the localization instantly, but imagine having to operate globally with all the data you need to do what you need to do. 

For example, our energy models are based on global datasets. Our local partnerships are based on manufacturing models from global partnerships. Our research partnership with Meta, our scaling partnership with AWS, all of those come because we are a global operator. But we also operate with the deep understanding that even though we are global, we have to customize what we do. 

Why do you think the LLMs appear unable to catch the nuance of a language like Japanese?

Subramaniyan: The biggest fault is that all of the data sets are extremely biased. What I mean by ‘biased’ is an asymmetric distribution of English versus non-English. Even in Latin languages or Latin-based languages, the distribution is asymmetric: I’m talking 99% to 1%. It’s not like a slight difference.

Even digitized non-English content comes primarily from the West or from sources we don’t have access to, such as China.

All that politeness, what is considered polite and impolite, what is considered near-natural human interaction came from the West. 

In developing this framework, was there a particular open source model that worked better than proprietary models?

Subramaniyan: We benchmarked against all open source models and all closed source models. But then we had to build these models from the ground up because we had to balance the data set. If you don’t balance the data set, you’re going to constantly keep having the same bias.

We have a concept called Model Mesh, which enables us to orchestrate and decide at runtime which models to call for what. We don’t necessarily need a large, general-purpose model that has to be fine-tuned for every task. We can have task-specific models that are independent and then make them work together as a system. Then the system is a runtime reasoning engine that we can run together.

Yes, we do use general-purpose models to acquire information about the world. But then, when it comes to Japan and the Japanese language, we have our own model.

The other question on people’s minds would be, ‘Oh my god, like do I need to build massive models for every single task?’

The answer is no, because we end up with a family of models that grow together. If a model does one task really, really well, that somehow influences and improves across the board.

Editor’s note: This interview has been edited for clarity and conciseness


Bitcoin Bull Market Likely Not Coming Back, Traders Admit

0

Bitcoin (BTC) fought to avoid a fresh price dive at Monday’s Wall Street open as traders increasingly gave up on the bull market.

Key points:

  • Many Bitcoin market commentators no longer see the return of the bull market.

  • BTC price action sees four consecutive red monthly candles for the third time in history.

  • Gold cooling off can still offer crypto a shot, says analyst.

Analyst: “Looks like” $126,000 was BTC price top

Data from TradingView confirmed a roughly 2% bounce for BTC/USD versus the daily open.

BTC/USD one-hour chart. Source: Cointelegraph/TradingView

Having set new 16-month lows of $74,532 on Bitstamp, the pair fielded more and more bearish predictions, with $74,000 and under now popular.

“The coming sessions are likely to be critical in shaping market direction for the remainder of the quarter,” trading resource QCP Capital wrote in its latest “Asia Color” market update. 

“A sustained close below the 74k support level would increase the risk of a deeper drawdown, potentially drawing the broader crypto complex back toward its 2024 trading range.”

Traders had little faith in a true market rebound from current levels.

“Weekly lower low on closing basis. Uptrend confirmed over,” trader Jelle told X followers in one of his latest posts.

“It’ll likely take a while before this turns around again.”

BTC/USD one-week chart. Source: Jelle/X

Trader and analyst Rekt Capital agreed that Bitcoin was unlikely to challenge its $126,200 all-time highs from October 2025.

“Looks like that was the top,” he concluded.

BTC/USD one-week chart. Source: Rekt Capital/X

Data from monitoring resource CoinGlass showed that BTC/USD had closed its fourth straight month in the red with the January close — a phenomenon seen just twice before, during the 2014 and 2018 bear markets.

BTC/USD monthly returns (screenshot). Source: CoinGlass

Gold correction can open crypto “floodgates”

After spending months going in opposite directions, Bitcoin and gold showed some short-term similarities on the day.

Related: BTC price heads back to 2021: Five things to know in Bitcoin this week

XAU/USD, which itself experienced a violent breakdown from all-time highs, attempted to stabilize at around $4,700 per ounce.

XAU/USD one-hour chart. Source: Cointelegraph/TradingView

QCP commented that the reversal on “deeply overbought” gold and silver was tied to the announcement of Kevin Warsh as the next Chair of the US Federal Reserve.

“This has weighed on demand for non-yielding precious metals, a move reinforced by higher margin requirements imposed by futures exchanges, which accelerated the unwinding of leveraged positions,” it added.

A glimmer of hope appeared for crypto trader, analyst and entrepreneur Michaël van de Poppe on the back of the latest events.

Bitcoin, he argued, could still repeat historical patterns and follow gold to all-time highs after a statutory delay.

“Historically, when Gold peaks, $BTC follows. When Bitcoin breaks back to $88k+, $ETH follows. That rhythm won’t change, the markets just became slightly more complicated,” an X post on the day stated. 

“I don’t think we’ll see new ATHs for Gold and Silver soon. In some years, yes, but not during 2026. That opens the floodgates towards Crypto.”

BTC/USD vs. XAU/USD one-week chart. Source: Cointelegraph/TradingView