Midas said it raised $50 million to solve a persistent pain point for onchain yield investors: liquidity.
The firm, which turns institutional yield strategies into blockchain-based tokens, closed a Series A funding round led by RRE and Creandum with backing from firms including Framework Ventures, Franklin Templeton and Coinbase Ventures.
The raise comes as institutions explore tokenized portfolios, with liquidity and settlement speed still limiting broader adoption. Many tokenized investment products operate through vault-like structures, deploying user funds into strategies such as lending or yield farming across DeFi protocols. While they can generate steady returns, they often lock up capital, forcing investors to wait for redemptions.
Midas will use the new funding to build and roll out a system that allows users to exit positions instantly, instead of waiting for days.
Dubbed Midas Staked Liquidity (MSL), the feature aims to end withdrawal delays with a separate liquidity layer that sits alongside its products. Instead of unwinding positions each time an investor exits, the system uses pre-allocated capital to fulfill withdrawals on demand.
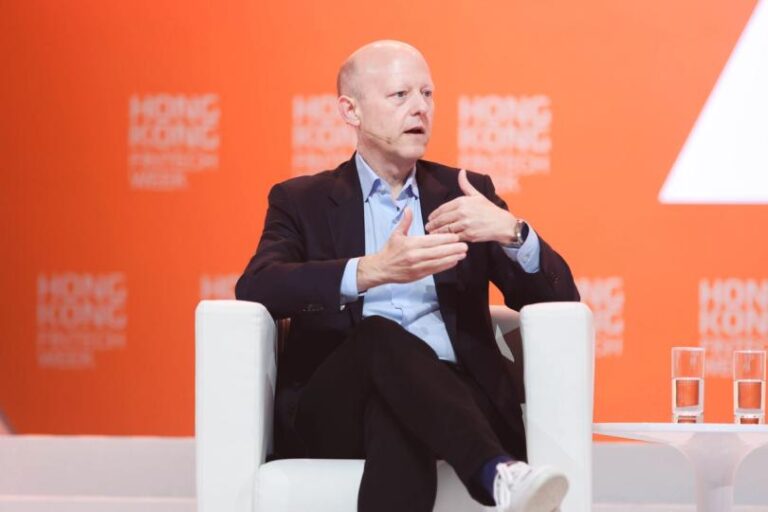
“This raise gives us the capital to scale the infrastructure behind it, enabling instant redemptions, deeper liquidity, and broader strategy access without sacrificing transparency or yield,” said co-founder and CEO Dennis Dinkelmeyer.
Since starting its 2024, Midas said it issued $1.7 billion in tokenized assets, distributing $37 million in yield to investors.
Prospects of interest rate rises are no longer just the U.S. story. Traders are now betting the Bank of Japan (BoJ) could tighten too as the resource-scarce nation faces inflation risks from the ongoing Iran war.
Traders see a roughly 69% chance of the BoJ raising its benchmark borrowing cost at the April 28 meeting, according to data tracked by Bloomberg. Action in options tied to U.S. interest rates shows traders expect the Fed to raise borrowing costs in the coming weeks.
BoJ’s policy meeting summary released Monday showed one member calling for a bigger rate hike in response to the conflict in the Middle East and its inflationary impact on Japanese society. Comments also noted that any move would factor in incoming economic data and anecdotal signals from the market.
The Fed’s tightening is a well-known headwind for risk assets, including bitcoin. The Bank of Japan can be just as impactful. Years of ultra-low rates encouraged traders to borrow in yen and invest in higher-yielding markets (the so-called carry trade), keeping borrowing costs suppressed globally and greasing rallies in risk assets.
So, a shift toward tighter policy in Tokyo could reverse these flows, sending ripples across markets and potentially deepening the crypto bear market. The BoJ has already raised its interest rate to 0.75% from -0.1% over the past two years while simultaneously ending its massive asset purchase program. Yet, rates in Japan remain significantly lower than the 3.5% seen in the U.S.
The bank, therefore, has plenty of room to hike if the Iran crisis worsens, potentially driving higher energy prices and imported inflation in Japan and other oil-dependent countries.
Easier said than done
Hiking rates, however, will be a challenging task given Japan’s strained fiscal situation. The country’s debt-to-GDP ratio stands at a staggering 240%, meaning higher rates could sharply increase borrowing costs and strain government finances.
Economists have said that Japan is caught between a rock and a hard place. If it hikes rates and allows government bond yields to rise, it could put Japan’s debt sustainability at risk. If it keeps rates low, the yen will likely depreciate significantly, adding to inflation concerns.
Strains are already evident in the FX market. The Japanese yen continues to weaken and is currently just around 160 per U.S. dollar, its weakest level since mid-2024. The JPY has depreciated by 54% since 2021.
Bitcoin (BTC) buyers made a tepid comeback on Monday, pushing BTC price to its intraday high of $67,860. Analysts said that Bitcoin remains in a bear market, with several metrics pointing to a potential bottom below $50,000.
Key takeaways:
Bitcoin price turns $70,000 into resistance, clearing the path for a deeper correction.
Bitcoin’s short-term holder realized price bands moved lower, with a potential bottom around $46,000.
Historical retracement levels and a bear flag breakdown point to $39,000–$41,000 as the final low for BTC price this cycle.
Bitcoin’s “path of least resistance” is downward
Data from TradingView captured ongoing BTC price gains, up 1.5% on the day to trade at $67,750, as $69,000-$70,000 became new resistance.
Analyzing Bitcoin’s price action on lower time frames, Telegram trading resource Technical Crypto Analyst said losing the $68,000-$69,000 support “confirms short-term bearish momentum,” adding:
“Unless price quickly reclaims $69K–$70K, the path of least resistance remains downward toward the $65K demand zone.”
Related: Worst six months since 2018? Five things to know in Bitcoin this week
“Great bounce upwards, but nothing confirmed as of yet on Bitcoin,” MN Capital founder Michael van de Poppe said in a Monday post on X.
It “all depends on macroeconomic events; however, I’d rather see a breakout above $71K for confirmation,” he added.
“On the other hand, a classic little sweep to $65K just before the push upwards would signal that we’re going to get that momentum.”
BTC/USD four-hour chart. Source: X/Michael van de Poppe
Analyst Kyle Chassé said that with the Fear and Greed index still in the “extreme fear zone” and the order books showing more shorts than longs, the market leans “towards more downside.”
Crypto fear and greed indeed. Source: X/Kyle Chassé
Where will the Bitcoin price bottom?
Bitcoin’s 46% drawdown from its $126,000 all-time high has seen the cost basis of short-term holders (STH) — the average price of entities who have held BTC for less than 155 days — drop from $113,500 to $83,200.
“This is a sign that the pricing for a potential bottom has also moved lower,” said CEO and founder at Alphractal Joao Wedson in an X post on Monday.
Similarly, the lower line of the STH realized pricing bands (blue line) has also moved “even lower, which could confirm that Bitcoin may form a bottom around $50K or slightly below,” Wedson added.
The chart below shows that Bitcoin bottomed out just below the lower band of the STH realized price during the 2022 bear market.
Analyst Willy Woo said that the bear market bottom for Bitcoin could be between its realized price, currently at $54,000, and the Cumulative Value-Days Destroyed (CVDD), now at $45,500.
“Old school onchain models suggest a BTC bottom between $46K-54K. ”
Bitcoin pricing models. Source: X/Willy Woo
The CVDD measures the cumulative value of “Coin Days Destroyed” (long-term holders selling) relative to the market’s age, creating a rising “floor” price during bear markets.
Crypto analyst Crypto Jelle said Bitcoin’s bear market lows have historically formed between the 0.618 and the 0.786 retracement levels, which are at $57,600 and $39,000, respectively.
BTC/USD weekly chart. Source: X/Jelle
As Cointelegraph reported, the current “last stages” of the bear market are producing predictions of as low as $41,000, based on a bear flag breakdown.
This article is produced in accordance with Cointelegraph’s Editorial Policy and is intended for informational purposes only. It does not constitute investment advice or recommendations. All investments and trades carry risk; readers are encouraged to conduct independent research before making any decisions. Cointelegraph makes no guarantees regarding the accuracy or completeness of the information presented, including forward-looking statements, and will not be liable for any loss or damage arising from reliance on this content.
Nearly two-thirds of US crypto investors are heading into tax season unaware of new reporting rules that could cost them up to $100,000, says a Monday report by Coinbase and CoinTracker shared with DL News.
Based on a survey of 3,000 American crypto investors, the 2026 Crypto Tax Readiness Report found that 61% of respondents said they are unaware of specific new rules introduced by the Internal Revenue Service for reporting 2025 taxes.
“The story this data tells is one of confusion,” Lawrence Zlatkin, Coinbase’s vice-president of tax, said in a statement shared with DL News.
“Users are struggling to navigate the complexities of crypto taxation, which is why it’s so important for us to help bridge that knowledge gap,” Zlatkin said.
The findings come ahead of April 15, the IRS federal income tax filing deadline for 2025.
Criminal tax fraud can lead to a fine of up to $100,000 and five years in prison, according to Cornell Law School. That would be the worst-case scenario for individuals convicted of serious and intentional wrong-doing, and not for people who made filing errors.
The understanding gap lands at a delicate moment. The new tax rules — found in the IRS’ new Form 1099-DA — means that investors should report gross proceeds from digital assets transactions.
The problem for individual investors is that they are responsible for calculating and reconciling their own adjusted cost basis across platforms as brokers aren’t required to provide cost basis accounting to the IRS for 2025.
“The cost basis issue is uniquely hard to solve,” Shehan Chandrasekera, head of tax strategy at CoinTracker, said in a note shared with DL News.
“If a crypto investor has transactions and transfers between multiple wallets and exchanges or is involved in decentralised finance, it will be almost impossible for them to reconcile crypto taxes manually,” Chandrasekera said.
Other findings
The report described the digital assets industry as an “environment of high compliance intent but low functional understanding highlights a critical need for accessible, accurate, and integrated crypto tax solutions.”
It found that 74% percent of crypto users say they know their activity is taxable, with 56% rating their own knowledge of crypto taxes as excellent.
Crypto investors also look increasingly mainstream. Of the people polled, 76% say they also invest in traditional stocks, and 83% hold other assets such as bonds, property or commodities.
Lance Datskoluo is DL News’ Europe-based markets correspondent. Got a tip? Email him at lance@dlnews.com.
By Omkar Godbole (All times ET unless indicated otherwise)
The crypto market started the week on a positive note, but further gains may be limited as signs of fresh capital inflows remain weak.
Ether (ETH) and solana (SOL) prices have risen over 3% since midnight UTC, with BTC up nearly 2% and XRP lagging at 1.5%. The CoinDesk 20 Index has gained 2% to 1,941 points.
The demand side, however, appears weak. The 11 U.S.-listed spot bitcoin exchange-traded funds (ETFs) registered a net outflow of $296.18 million, snapping a four-week streak of inflows, according to data source SoSoValue. Ether ETFs bled over $200 million. These funds are seen as a proxy for institutional appetite for cryptocurrency.
The other route through which capital flows into the digital asset market is stablecoins, or tokenized versions of fiat currencies such as the dollar, and that is also flashing a red signal.
The growth in the market cap of Tether’s USDT, the world’s largest dollar-pegged stablecoin, has stalled at around $184 billion over the past two weeks. The market cap of Circle Internet’s (CRCL) USDC, the second-largest, has declined nearly 1.5% to $77.77 billion.
“Last week, Stablecoins experienced a $-1.1 billion decrease, a negative signal, compared to previous minting, which is in the 2nd percentile. During the last 30 days, a total of $0.8 billion was minted,” Markus Thielen, founder of 10x Research, said in a note to clients Monday.
Veteran chart analyst Peter Brandt said bitcoin’s current price action aligns with classic technical analysis patterns, and prices could fall to as low as $49,000. Options show a bias for put options across all time frames, a sign of lingering downside fears among traders.
Still, a sudden shift in sentiment, perhaps triggered by a potential U.S.-led ceasefire in the Iran conflict, could spark a rally in bitcoin and other risk assets. However, the BTC price would need to establish a firm foothold above $75,000 to signal a full bullish reversal. Stay alert!
Read more: For analysis of today’s activity in altcoins and derivatives, see Crypto Markets Today
What to Watch
For a more comprehensive list of events this week, see CoinDesk’s “Crypto Week Ahead”.
Crypto
Macro
Earnings (Estimates based on FactSet data)
March 30: Nano Labs (NA), pre-market
Token Events
For a more comprehensive list of events this week, see CoinDesk’s “Crypto Week Ahead”.
Governance votes & calls
Unlocks
Token Launches
March 30: BASED token generation event to occur.
Conferences
For a more comprehensive list of events this week, see CoinDesk’s “Crypto Week Ahead”.
Market Movements
BTC is up 1.48% from 4 p.m. ET Sunday at $67,388.07 (24hrs: +1.41%)
ETH is up 2.78% at $2,051.71 (24hrs: +2.87%)
CoinDesk 20 is up 2.05% at 1,940.98 (24hrs: +1.61%)
Ether CESR Composite Staking Rate is down 6 bps at 2.70%
BTC funding rate is at 0.0007% (0.7939% annualized) on Binance
DXY is up 0.23% at 100.09
Gold futures are up 1.55% at $4,561.70
Silver futures are up 2.38% at $71.20
Nikkei 225 closed down 2.79% at 51,885.85
Hang Seng closed down 0.81% at 24,750.79
FTSE 100 is up 0.54% at 10,021.13
Euro Stoxx 50 is unchanged at 5,501.70
DJIA closed on Friday down 1.73% at 45,166.64
S&P 500 closed down 1.67% at 6,368.85
Nasdaq Composite closed down 2.15% at 20,948.36
S&P/TSX Composite closed up 0.23% at 31,960.70
S&P 40 Latin America closed down 0.75% at 3,473.97
U.S. 10-Year Treasury rate is up 2 bps at 4.44%
E-mini S&P 500 futures are up 0.35% at 6,435.00
E-mini Nasdaq-100 futures are up 0.28% at 23,394.00
E-mini Dow Jones Industrial Average futures are up 0.31% at 45,566.00
Bitcoin Stats
BTC Dominance: 58.52% (0.21%)
Ether-bitcoin ratio: 0.03048 (1.36%)
Hashrate (seven-day moving average): 1,018 EH/s
Hashprice (spot): $31.84
Total fees: 1.63 BTC / $108,730
CME Futures Open Interest: 121,295 BTC
BTC priced in gold: 14.9 oz.
BTC vs gold market cap: 4.49%
Technical Analysis
NVDA’s price has crossed below the bull market trendline support. (TradingView)
The chart shows weekly price swings in Nvidia (NVDA) in candlestick format.
Prices have dropped 7% over the past two weeks, breaking out of a trendline that characterized the bullish trend from late 2022 lows.
This breakdown suggests weakening momentum and raises the risk of a deeper correction.
NVDA is the bellwether of all things AI and has had a positive correlation with bitcoin in the past.
Crypto Equities
Coinbase Global (COIN): closed on Friday at $161.14 (–7.06%), +2.38% at $164.98 in pre-market
Galaxy Digital (GLXY): closed at $18.00 (–8.21%), +2.78% at $18.50
MARA Holdings (MARA): closed at $8.02 (–6.53%), +2.00% at $8.18
Riot Platforms (RIOT): closed at $12.80 (–8.60%), +2.19% at $13.08
Core Scientific (CORZ): closed at $15.07 (–4.56%), +1.53% at $15.30
CleanSpark (CLSK): closed at $8.66 (–6.88%), +3.58% at $8.97
Exodus Movement (EXOD): closed at $6.48 (–5.40%), –3.40% at $6.26
CoinShares Bitcoin Mining ETF (WGMI): closed at $35.19 (–5.10%), +2.87% at $36.20
Circle Internet Group (CRCL): closed at $93.66 (–4.69%), +2.28% at $95.80
Bullish (BLSH): closed at $34.43 (–5.52%), +0.78% at $34.70
Crypto Treasury Companies
Strategy (MSTR): closed at $126.03 (–5.19%), +1.88% at $128.40
Strive Asset Management (ASST): closed at $9.85 (–5.33%), –0.25% at $9.83
Sharplink (SBET): closed at $6.04 (–7.50%), +3.57% at $6.26
Upexi (UPXI): closed at $1.00 (–6.54%), +2.00% at $1.02
The Ethereum Foundation has accelerated its treasury staking push, deploying $46.2 million in Ether in its largest move to date after the recent BitMine sale.
On Monday, the foundation’s treasury multisignature wallet made 11 deposits into the Ethereum Beacon Deposit Contract, each of roughly 2,047 Ether (ETH), totaling 22,517 tokens worth roughly $46.2 million, according to data from Arkham Intelligence.
The Ethereum Foundation started staking ETH in February, depositing 2,016 ETH and outlining plans to stake up to 70,000 ETH, with rewards reinvested into research, ecosystem development and grants.
EF staking ETH. Source: Arkham
The foundation also deposited a smaller 31 ETH tranche earlier this month, bringing the total staked holdings to roughly 24,564 ETH as it shifts to staking to generate yield, rather than relying on periodic ETH sales, which have historically drawn criticism.
Related: Ethereum builders propose ‘economic zone’ to tackle L2 fragmentation
EF sells 5,000 ETH to BitMine in OTC deal
The new staking move comes after the EF completed an over-the-counter (OTC) sale of 5,000 Ether to BitMine Immersion Technologies, valued at about $10.2 million. The foundation said proceeds would support core operations, including protocol research, ecosystem growth and community grants.
The transaction marked the foundation’s second direct OTC sale to a corporate buyer, following a 10,000 ETH sale to SharpLink Gaming in July 2025.
The EF currently holds about $361 million in onchain assets, with the vast majority, roughly $360.8 million, held in Ether on the Ethereum network, alongside small balances across networks like Arbitrum, Optimism and Bitcoin, according to Arkham.
Related: Ethereum risks losing No. 2 spot as stablecoins gain ground
Ether price risks further decline
Ether fell below the $2,000 level over the weekend, raising the risk of a deeper correction. Analysts, including Onur, CryptoWZRD and Ted Pillows, pointed to repeated failures at $2,200 and weakening momentum, with some warning ETH could fall toward the $1,750–$1,850 range.
Demand for Ether has also turned negative, hitting its lowest level in 16 months, according to Capriole Investments.
Magazine: Ethereum’s Fusaka fork explained for dummies — What the hell is PeerDAS?
Cointelegraph is committed to independent, transparent journalism. This news article is produced in accordance with Cointelegraph’s Editorial Policy and aims to provide accurate and timely information. Readers are encouraged to verify information independently. Read our Editorial Policy https://cointelegraph.com/editorial-policy
U.S. president Donald Trump posted on Truth Social Monday that the United States is “in serious discussions with a new, and more reasonable, regime” to end military operations in Iran, the first public acknowledgment of a regime change in Tehran since the conflict began five weeks ago.
The phrase “new regime” suggests the leadership structure that existed when the war started is no longer in place.
In the same post, however, Trump demanded the Strait of Hormuz be “immediately open for business” and threatened to “blow up and completely obliterate” Iran’s electric generating plants, oil wells, and Kharg Island if a deal is not reached shortly. He added that desalination plants were also under consideration.
These are all targets the U.S. has deliberately avoided hitting for the duration of the five-week conflict.
The combination of a potential ceasefire with a new government and the most explicit threat to civilian and energy infrastructure yet makes this a two-sided headline that the market will struggle to price cleanly.
The de-escalation signal is that talks are happening with a new regime and “great progress” has been made. The escalation signal is that the president just publicly listed every piece of critical infrastructure he’s prepared to destroy if those talks fail.
Bitcoin jumped to $67,580 on the news, up 1.3% in the past 24 hours. Ether outperformed, up 3.1% to $2,064. Solana gained 1.9% to $84.09 and XRP added 1.0% to $1.35. The weekly picture is still uniformly red — with BTC down 1.3%, XRP 1.2%, SOL 2.2% — but Tron continues to quietly outperform the entire majors complex, up 1.3% in 24 hours and 5.3% on the week.
The bounce squeezed a lot of shorts on the way up, meanwhile. CoinGlass data shows $9.32 million in short liquidations in the last hour alone against just $207,000 in longs.
Traders took on $340 million in liquidations over a 24 hours window, absorbing the bulk at $242.25 million from the overnight flush before the Trump post landed. The largest single order was a $9.8 million BTCUSD liquidation on Bybit.
In its latest post to Telegram channel subscribers, analytics resource Technical Crypto Analyst wrote:
“BTC is showing a clear shift in structure on the 4H, with price forming lower highs and losing the 68–69k support, which now acts as resistance; this confirms short-term bearish momentum, and unless price quickly reclaims 69–70k, the path of least resistance remains downward toward the 65k demand zone.”
Last week, Cointelegraph reported on $70,000 rapidly becoming new resistance, with a key long-term trend line at $68,300 unable to function as support.
“BTC’s local uptrend is over – as expected – and price is starting to move lower again,” trader Jelle continued on Monday.
“Testing the previous lows as resistance as we speak; bears are back in the drivers’ seat.”
BTC/USD one-day chart. Source: Jelle/X
Others also focused on the continuing breakdown of Bitcoin’s second bear flag of 2026 — something that has already sparked sub-$50,000 BTC price targets.
“Repeating the exact same bear flag breakdown like we saw in January,” trader Roman summarized.
Iran war rattles stocks with inflation in focus
Macro markets remain highly sensitive to developments in the US-Iran war, and these keep coming as April arrives.
US President Donald Trump reported a “big day” militarily to start the week amid reports of plans for a ground invasion of Iran.
BREAKING: President Trump is weighing a military operation to extract nearly 1,000 pounds of uranium from Iran, per WSJ.
Details include:
1. This is considered a “complex and risky” mission that would likely put American forces inside the country for days or longer
Asia stock markets opened sharply down on Monday as the impact of the oil-supply crisis made its presence felt.
“The ongoing tensions means that tanker traffic through the Strait of Hormuz remains limited, which continues placing strains on global energy markets along with uncertainty over access to fertilizer products for farming,” trading resource Mosaic Asset Company commented in the latest edition of its regular newsletter, “The Market Mosaic.”
“That’s weighing on the S&P 500, which has now closed out five consecutive weeks with a loss.”
Mosaic noted that the S&P’s red streak was now the longest since the 2022 Russia-Ukraine war.
“The growing risk of lasting damage on the global economy from high energy prices is pressuring the stocks market,” it continued.
“But perhaps the most consequential spillover impact is on the outlook for inflation, and implications for interest rates on both the short- and long-end of the yield curve.”
Federal Reserve target rate probabilities (screenshot). Source: CME Group FedWatch Tool
As Cointelegraph reported, crypto markets joined stocks in a comedown in late March as the odds of the Federal Reserve cutting interest rates in 2026 faded. At the same time, bets of a recession coming this year increased to their highest since last September.
Fed Chair Jerome Powell is due to take to the stage on Monday, potentially offering more insight into officials’ positions on the economy. Powell will participate in a moderated discussion at the Harvard University Principles of Economics Class.
“The outlook for rate cuts by the Federal Reserve is in jeopardy, while long-term rates are jumping higher as well due to uncertainty around inflation,” Mosaic added.
“The 30-year Treasury yield is close to breaking higher from an ominous pattern that could mean sharply higher rates ahead.”
March risks becoming sixth red BTC price month
Bitcoin bulls have little to boast about as March comes to a close, with BTC/USD about to seal its sixth consecutive month of losses.
Data from CoinGlass shows the result on a knife-edge ahead of the monthly close, with a “green” finish still possible.
If Bitcoin ends March lower than its starting price, it would mark the first six straight “red” months since the 2018 bear market.
“Very slow month so far all things considered. Bitcoin pretty much flat on the month just like last year,” trader Daan Crypto Trades commented about the CoinGlass data.
Daan Crypto Trades noted that over Bitcoin’s history, April has always been comparatively strong.
“Historically speaking, April is bitcoin’s 3rd best month in average returns,” he added.
Trader XO observed that in February 2019, following Bitcoin’s first six-month losing streak, monthly gains totaled 11%.
“If April sees an early sweep into the $55–60K range, it could create a compelling setup for mean-reversion longs imo… (much depends on the overall macro landscape),” they told X followers.
“That said, the higher timeframe structure remains in control until a clear contextual ‘structural’ shift is confirmed.”
Bitcoin whales flip defensive
Bitcoin whales have sparked concerns about future downward pressure on BTC price action.
After an “aggressive” accumulation period at the start of 2026, whales have started reconsidering their exposure, per data from onchain analytics platform CryptoQuant.
“A clear divergence has formed: on-chain buying has ceased while large-scale inflows to exchanges are rising,” contributor Sunny Mom wrote in a “QuickTake” blog post.
“Although the price continues to oscillate around $67K, the data suggests the market is entering another phase of hand-overs (re-distribution).”
Bitcoin exchange whale ratio (screenshot). Source: CryptoQuant
CryptoQuant noted increasing whale presence among exchange inflows, with their wallets accounting for more of the largest inbound transactions.
“Furthermore, the stablecoin ratio remains at a low level, reflecting a slowdown in sidelined capital flowing into the market,” Sunny Mom added, referring to stablecoin trends.
“Without fresh liquidity, any attempt by whales to realize gains from their previous on-chain accumulation must rely on existing liquidity, making the price highly sensitive to selling pressure.”
Bitcoin exchange stablecoin ratio (screenshot). Source: CryptoQuant
Newer holders sit on “massive supply overhang”
Offering a hint of optimism this week, onchain analytics platform Glassnode sees promise in overall demand tendencies at current prices.
Related: Bitcoin value ‘off the chart’ as BTC price metric hits record lows in 2026
Between $60,000 and $70,000, it notes, new BTC buyers have their aggregate cost basis.
“BTC sits at the lower bound of the new buyers’ cost basis range ($60k–$70k),” it wrote in an X post on Monday.
“Supply accumulation in this range is notable, but the cluster is thinner than historical analogs that preceded a strong recovery.”
Bitcoin short-term holder cost basis distribution heatmap. Source: Glassnode
For a sustained rebound to begin, demand simply needs to ramp up — something not yet underway as traders stay nervous about geopolitical and macroeconomic shocks.
“The accumulation setup is constructive in form, not yet in magnitude,” Glassnode added.
Previously, Cointelegraph analyzed the various aggregate cost bases of Bitcoin investor cohorts, including that of short-term holders (STHs), the majority of whom are now underwater on their BTC holdings.
Last week, CryptoQuant calculated STH share of the overall supply at 5.7 million BTC, with 92% sitting on losses.
“That’s a massive supply overhang,” it warned.
Bitcoin STH in profit/loss. Source: CryptoQuant/X
This article is produced in accordance with Cointelegraph’s Editorial Policy and is intended for informational purposes only. It does not constitute investment advice or recommendations. All investments and trades carry risk; readers are encouraged to conduct independent research before making any decisions. Cointelegraph makes no guarantees regarding the accuracy or completeness of the information presented, including forward-looking statements, and will not be liable for any loss or damage arising from reliance on this content.
The crypto market staged a recovery on Monday with bitcoin BTC$67,442.95 rising by 2.1% since midnight UTC and ether (ETH) adding 3.1%. Stronger gains occurred in the altcoin market, with tokens such as chiliz (CHZ), FET$0.2416 and optimism OP$0.1077 notching advances of more than 6%.
Despite the improvement in sentiment, investors remained uneasy as the conflict with Iran enters a fifth week. While Pakistan expressed readiness to host “meaningful” peace talks, the markets aren’t buying it yet. Brent crude jumped to $108 per barrel over the weekend, signaling deep skepticism that a resolution is near. It was trading in the low $70s before the start of hostilities.
U.S. stock index futures responded well to Pakistan’s comments: Nasdaq 100 futures and S&P 500 futures both advanced 0.25%, and the dollar index (DXY) was little changed at 100.2 points.
The crypto market remains in a bearish trend on higher time frames, characterized by a series of lower highs and lower lows dating back to October. Bitcoin has remained in the same trading range since early February, failing to break above $75,000 to the upside or below $62,800 to the downside.
Derivatives positioning
Growth in bitcoin futures open interest (OI) has stalled since hitting a near two-month high of 748.65 BTC on Saturday. Near-zero perpetual funding rates and negative 24-hour cumulative volume delta (CVD) suggest a bias for bearish, short positions.
BTC OI declined notably during the spot price bounce from the Asian-session low of around $65,000. It shows that the rally is largely spot-driven and has yet to win the backing of leveraged traders.
On Bittfinex, the number of BTC/USD longs hit the highest since November 2023. Historically, this has been a contrary indicator, coinciding with price selloffs.
OI in most major tokens, including XRP, ETH, DOGE and SOL, has held largely flat over 24 hours.
AVAX and LTC stand out with double-digit percentage gains in futures OI, a sign of capital inflows. Most inflows, however, seem tied to bearish bets, as indicated by their negative CVDs.
Bitcoin’s 30-day implied volatility index is under pressure again, falling to nearly 55% after hitting 58% over the weekend. Overall, the index continues to indicate market calm despite the Iran war-led turmoil in traditional markets. Ether’s volatility index suggests the same.
On Deribit, BTC and ETH puts continue to cost more than calls across all time frames in a sign of lingering downside worries. Dealer gamma is predominantly negative between $65,000 and $70,000, which means dealers could buy low and sell high, potentially keeping prices range-bound.
Token talk
The CoinDesk Memecoin Index (CDMEME) and the DeFi Select Index (DFX) were the two best-performing benchmarks on Monday, rising by 2.8% and 2.2%, respectively, while the bitcoin-dominant CoinDesk 20 (CD20) added 1.5%.
The perceived strength of the altcoin market can be attributed to a market-wide lack of liquidity. When prices tumbled Friday, the amount of supply on exchanges outweighed demand. This sent several assets well into “oversold” territory” as the move was exaggerated, leading to today’s relief rally.
This liquidity void has plagued the crypto market since October, when a $19 billion liquidation event wiped out market structure, leaving several traders and market makers stranded in its wake.
In order to break that cycle, bitcoin, the market’s anchor, needs to trade back above $80,000 and consolidate, which would mean gains could rotate into the more speculative altcoin market to establish macro levels of support.
Traveling from the grey skies of London to the crisp, canal-side air of the Eye Filmmuseum in Amsterdam, I arrived at The Banking Scene with a single question: In an era of digital exhaustion, how does a bank stay relevant? The theme, “Rethinking Relevance,” wasn’t just a marketing slogan; it was a survival manual for an industry facing the “agent-first era.”
The day kicked off with a high-tempo keynote that set the stage for the massive transformation ahead. Peter, our keynote speaker, didn’t just talk about AI; he let his AI agent, Sarah, hijack the stage. “Assistants ask permission,” Sarah told us. “Agents, like me, take the stage.”
From Puppets to Actors
Peter’s breakdown of the AI evolution was a wake-up call for many. He described the journey from the “puppet” (simple chatbots) to the “servant” (assistants) and finally to the “actor”—the true agent.
“If you’re still building chatbots, you will get some bad news later on today.”
This shift is fundamental because agents don’t wait for a swipe or a click; they act. Peter argued that we are reaching the end of the mobile era, which has become a “remote control of my life” but one that leads to “digital exhaustion.”
The future is ambient, embedded, and face-to-face AI.
Cutting Through the “Agent Washing”
One of the most insightful discussions of the day featured Sára Hanniker, Head of AI Solutions at FinShape. In a market currently flooded with “agent washing”—where every legacy tool is suddenly rebranded as an agent—Sára provided much-needed clarity.
She noted that while banks have long claimed to be a “goldmine for data,” they haven’t known what to do with it. “The back is what to do with this knowledge, how to act upon them, how to be proactive,” she explained. Sára’s vision for a true AI Financial Assistant moves beyond simple alerts. Instead of just stating your balance dropped, an agent should interact:
“I saw that your balance increased. What about saving more? And then you can discuss it with your client… the AI could say, okay, then let’s set up a recurring transfer.”
She emphasized that this isn’t just a technology problem, but a cultural one. “How to change the mindset, how to achieve this cultural shift, and yes, to learn how to utilise the data,” is the real challenge for established institutions.
Digital Assets: Beyond the POC
The afternoon shifted focus to the complex world of digital assets and infrastructure. The panel, featuring experts like Anoush (Zodiac Custody), Sergei (Rabobank), and Sarah Liebing (Dutch Central Bank), tackled why, after a decade of pilots, we aren’t at “global digital asset domination” yet.
The Cash Leg Gap: Xavier noted that while tokenizing assets like bonds is “the easy part,” the cash leg remains a “menu of imperfect options.”
Liability and Risk: “Institutional investors… need to know the full remediation path when something goes wrong, and that just isn’t clear,” Xavier warned.
Central Bank Movement: Sarah Liebing provided a more optimistic view from the Dutch Central Bank (DNB), noting that they are moving from “idea and just a pilot” to actual products, with settlement in wholesale CBDC expected by Q3.
Anoush pointed out that the technology is solved, but the legal frameworks are the hurdle. “Innovating even where you may not have the end answer immediately… shouldn’t stop the innovation in the interim,” she argued.
The Human Element: The “Orchestrator”
A recurring theme throughout the day was the impact on people. Peter noted that 92 million jobs are at risk according to the World Economic Forum, leading to an “identity crisis.” However, he suggested a pivot from being a “specialist collaborator” to a “generalist orchestrator.”
“We should be hiring people for what they can oversee and what they can validate. They should be hired for how good they are as an orchestrator.”
This requires maintaining “human judgment” and “critical thinking” to ensure we don’t suffer from “atrophy of the mind” by delegating everything to machines.
Final Thoughts
As the sun set over the IJ River, the takeaway was clear: the industry is moving from “waiting to seeing technology act.” Whether it’s through the agentic workflows championed by Sára Hanniker or the infrastructure shifts discussed in the digital asset panels, the “puppet” era of banking is over.
A massive well done to Rik Coeckelbergs and Andrew Vorster for curating an event that was as challenging as it was inspiring. Bringing together regulators, incumbents, and disruptors in one room is no easy feat, but they managed to create a space where the “rethinking” actually happens. Amsterdam remains the beating heart of European fintech, and I’m already looking forward to next year’s progress report.