At InsurTech NY, Chris Luiz from Scout Insurtech believes he is working to solve the single most important problem facing the insurance industry: its historical struggle to engage effectively with technology.
Scout Insurtech argues that simply maintaining a “tech-forward posture” is not enough to succeed and instead, he dedicates a huge amount of time to creating situations where people build genuine, real-world relationships to figure out how Scout Insurtech can actually engage and partner with technology companies.
For Luiz, this relationship building is the biggest challenge the industry faces and praises events like InsurTech NY for matching him with people who are truly looking outside their own companies for opportunities, which served as a model for Scout Insurtech’s own conference ecosystem.
Luiz thinks that most people are underestimating how quickly and profoundly the advent of AI will change roles and the fundamental engagement model across the business. People accustomed to working solely behind a computer will soon find themselves with little to do if they cannot shift to having meaningful conversations and building relationships to drive business.
The more interesting, long-term effect of AI, according to Scout Insurtech, is a systemic shift in leadership development. As AI takes over many front-line positions, such as those in claims and call centers, the insurance industry will lose its traditional talent pipeline where future executives gain a fundamental understanding of the business by rising through those ranks.
Luiz notes that this creates a paradoxical problem as Scout Insurtech is now building software and training programs designed to deliberately emulate the experience of being a front-line claims adjuster to properly prepare people for higher-level management and executive roles.
The US Securities and Exchange Commission (SEC) has issued a staff statement clarifying how the agency plans to interpret software interfaces facilitating crypto transactions in its broker-dealer regulations.
In a Monday statement, the SEC’s Division of Trading and Markets staff said that under certain circumstances, interfaces that “assist users engaging in user-initiated crypto asset securities transactions on blockchain protocols […] utilizing the user’s self-custodial wallet” may not necessarily be required to register as a broker-dealer with the agency.
Source: SEC
The SEC statement specified that self-custodial wallets with such user interfaces may be exempt from registration requirements, provided they do not “solicit investors to engage in any specific crypto asset securities transactions,” provide commentary on “any potential execution [routes] displayed to a user,” and other circumstances.
Although the staff statement does not carry the same weight as a proposed SEC rule subject to public comment and review, it was intended to “provide greater clarity on the application of the federal securities laws to activities involving crypto asset securities.”
It follows several others that the SEC has issued following the inauguration of US President Donald Trump in January 2025, leading to new leadership at the agency in what many have seen as friendlier to the crypto industry.
Related: Ex-SEC, Coinbase staffer becomes Securitize president
“While the staff expressing its view is helpful, I favor a more permanent regulatory approach that addresses the broker definition in light of current market circumstances,” said SEC Commissioner Hester Peirce, adding:
“Crypto is forcing the Commission to confront its inner demons that have driven it toward ever more expansive readings of the securities laws.”
SEC leadership is still entirely Republican and understaffed
Although Trump announced several new nominations for various federal positions on Monday after a month of silence on the matter, no additional picks for the SEC or Commodity Futures Trading Commission (CFTC) were among the president’s names. Both financial regulators responsible for overseeing crypto regulation in the country face a dearth of leadership amid resignations and lack of nominations from the White House.
At the SEC, only three Republican commissioners out of five remain, while only CFTC Chair Michael Selig, also a Republican, serves at the commodities regulator following the departure of Caroline Pham in December.
Some lawmakers have proposed attaching a provision to a market structure bill under consideration in the Senate to require a minimum level of staffing at the SEC and CFTC before the legislation can take effect.
Magazine: Bitcoin quantum-safe without upgrade? CZ’s 2031 crypto vision: Hodler’s Digest, April 5 – 11
Cointelegraph is committed to independent, transparent journalism. This news article is produced in accordance with Cointelegraph’s Editorial Policy and aims to provide accurate and timely information. Readers are encouraged to verify information independently. Read our Editorial Policy https://cointelegraph.com/editorial-policy
Trusted Editorial content, reviewed by leading industry experts and seasoned editors. Ad Disclosure
DeFi has reclaimed $95 billion in total value locked. The number is significant. What it represents is more significant than the number.
A CryptoQuant report drawing on DeFiLlama data has identified a recovery that goes beyond the return of capital. After the post-2021 correction erased the speculative froth from the DeFi market, the $95 billion now locked in on-chain protocols reflects something the 2021 peak did not: sustained inflows driven by real demand rather than yield-chasing momentum. The capital has returned. This time, it appears to be staying.
The structural shift the report identifies beneath the TVL figure is the more consequential development. DeFi is no longer being evaluated primarily as a high-yield speculation venue. It is being re-evaluated as financial infrastructure — a replacement for the intermediary layer that traditional finance places between users and their assets. The distinction is fundamental: in traditional finance, institutions hold assets on behalf of users. In DeFi, users hold their own assets via smart contracts. Trust moves from institutions to code.
At the center of that shift is self-custody — and in Japan, that shift is becoming practical rather than theoretical. Hashport Wallet is lowering the barrier to private key ownership for mainstream users, making the infrastructure of self-custody accessible to a population that has historically kept its financial assets in institutional hands.
The DeFi Infrastructure Is Assembling. Japan Is Watching Closely
The report identifies stablecoins as the connective tissue that makes DeFi functional rather than theoretical. Price-stable assets solve the fundamental friction that prevented cryptocurrency from replacing traditional payment infrastructure: volatility.
When the medium of exchange fluctuates 10% in a session, it cannot serve as a foundation for payments, transfers, or lending. Stablecoins remove that friction. Their expanding global market size is not a crypto trend — it is the growth of a settlement layer that real-world financial activity increasingly depends on.
The Ethereum network data provides the on-chain confirmation. Transaction activity has surged recently — and the report draws the distinction that matters most in interpreting that surge. When network activity increases alongside rising prices, it suggests organic demand rather than speculative positioning. Users are not just betting on Ethereum. They are using it. That combination — activity growth and price growth occurring together — is the signature of a strengthening on-chain economy rather than a reflexive bubble.
Ethereum Transaction Count | Source: CryptoQuant
Japan is translating these global developments into a domestic financial model with a specific architectural choice. JPYC — a yen-denominated stablecoin — makes the entire DeFi stack practically accessible to Japanese users and institutions in local currency. The friction of currency conversion, the barrier of dollar-denominated protocols, the regulatory complexity of foreign stablecoin exposure — JPYC addresses all three simultaneously.
What JPYC and Hashport are building together is not a crypto product. It is a national financial access layer: self-custody infrastructure paired with a local-currency settlement asset, delivering the full capability of global DeFi to a population that holds some of the world’s largest household savings. That combination — accessibility, sovereignty, and local currency denomination — is what the report identifies as a uniquely viable model for regulated economies entering on-chain finance.
Stablecoin Dominance Stalls After Sharp Expansion
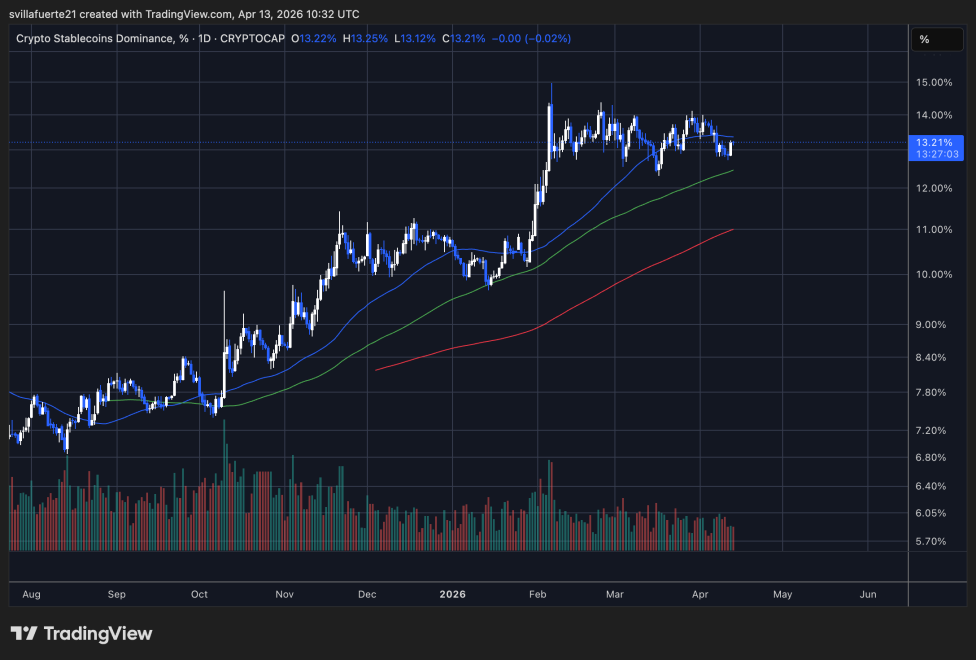
Stablecoin dominance has entered a consolidation phase after a strong upward move that defined late 2025 and early 2026. The chart shows a clear expansion from roughly 7% to above 13%, reflecting a significant shift in capital positioning. That rise typically signals a defensive market environment, where participants rotate out of volatile assets into stablecoins.
Crypto Stablecoins Dominance (DeFi) | Source: STABLE.C.D chart on TradingView
Since peaking near the 14% region in February, dominance has stabilized around 13.2%, forming a horizontal range rather than continuing higher. This shift from expansion to consolidation suggests that the initial risk-off move has already occurred, and the market is now in a holding pattern rather than actively de-risking further.
Technically, the structure remains constructive. Stablecoin dominance is holding above its 50-day (blue) and 100-day (green) moving averages, both trending upward, while the 200-day (red) continues to rise below. This alignment confirms that, despite the pause, the broader trend of capital preservation remains intact.
Structurally, this is a plateau at elevated levels. A break above 14% would signal renewed risk aversion, while a move below 12% would indicate capital rotating back into crypto assets. For now, the market remains cautious, not yet risk-on.
Featured image from ChatGPT, chart from TradingView.com
Editorial Process for bitcoinist is centered on delivering thoroughly researched, accurate, and unbiased content. We uphold strict sourcing standards, and each page undergoes diligent review by our team of top technology experts and seasoned editors. This process ensures the integrity, relevance, and value of our content for our readers.
Foundry Digital, the largest Bitcoin BTC$74,211.91 mining pool by hashrate, launched a Zcash (ZEC) mining pool that quickly grew to control about 30% of the network’s hashrate, according to company data and its newly released block explorer.
The New York-based firm said multiple institutional miners joined the pool ahead of its public debut, following an initial announcement in March.
Alongside the pool, Foundry introduced Zcashinfo.com, a block explorer that tracks network activity. The site shows pool rankings, hashrate distribution, block data and mining difficulty in real time.
Zcash, launched in 2016, lets users send transactions on a public blockchain while keeping key details private through zero-knowledge proof technology. The network can verify that a transaction is valid without revealing the sender, receiver or amount involved using a cryptographic method known as zk-SNARKs.
The network, like Bitcoin, relies on proof-of-work mining, where specialized machines compete to solve cryptographic puzzles in exchange for rewards paid in newly issued ZEC tokens and transaction fees.
Blocks on Zcash are produced roughly every 75 seconds, far faster than Bitcoin’s 10-minute cycle, though both networks cap supply at 21 million coins. Zcash uses the Equihash algorithm, which is designed to require large amounts of memory, unlike Bitcoin’s SHA-256 system.
Because the odds of solving a block alone are low, miners often group into pools to combine computing power and share rewards. That structure has made large pools central to network performance, as they can control sizable portions of total hashrate.
Foundry’s pool distributes rewards through transparent addresses and uses a pay-per-last-N-shares (PPLNS) model, which tracks miner contributions over time to calculate payouts.
The pool is open to new institutional participants, with onboarding focused on regulated entities.
Crypto markets shrugged off collapsing peace talks and surging oil prices, with BTC, ETH, and major altcoins posting gains.
Bitcoin climbed above $73,000 on Monday even as U.S.-Iran peace talks collapsed in Islamabad over the weekend and President Trump ordered a blockade of ships transiting the Strait of Hormuz en route to Iranian ports.
The largest cryptocurrency by market capitalization is trading at roughly $73,113, per CoinGecko, up about 2.8% over the past 24 hours. Ether gained approximately 2.5% to $2,254. The total crypto market capitalization increased 2% to $2.55 trillion, per CoinMarketCap, while Bitcoin dominance approached 60% for the first time since early March.
BTC Chart
The geopolitical flare-up followed 21 hours of negotiations in Pakistan that ended without an agreement between the two sides. Trump announced the Hormuz blockade on Sunday, reportedly allowing passage only for ships bound for U.S. ally ports.
Oil prices briefly surged roughly 9% to $105 per barrel on the news, but have since settled to around $98.
Bitcoin open interest sat at $54.9 billion, per CoinGlass. Roughly $297 million in crypto positions were liquidated over the past 24 hours, with shorts bearing the brunt.
ETF Flows Turn Positive
Despite the geopolitical turbulence, U.S. spot Bitcoin ETFs posted a net inflow of $786 million last week, per SoSoValue, bringing total net assets to $95 billion.
U.S. spot Ethereum ETFs also saw $187 million in net inflows last week, with BlackRock’s ETHA contributing $168 million. Four ETH spot ETFs posted positive flows. Total ETH ETF net assets stood at $12.96 billion.
Altcoin Movers
RaveDAO (RAVE) was the standout performer, surging about 97% in 24 hours, capping a 1,000%+ weekly rally. Meanwhile, AAVE and Hyperliquid (HYPE) gained about 6%.
Among major altcoins, Solana gained 2.4% to $84, XRP added 1.3% to $1.35, and BNB rose 2.5% to $608, per CoinGecko.
On the downside, Polkadot’s DOT slipped 5% to $1.19 after a bridge exploit involving the Polkadot-Ethereum Hyperbridge gateway.
The White House’s main crypto adviser, Patrick Witt, said that work is still being done to lock in the compromise that he thinks will move the Digital Asset Market Clarity Act forward in the U.S. Senate, though he said several other points are also being worked out behind the scenes.
In an interview on CoinDesk TV Monday, the executive director of the President’s Council of Advisors for Digital Assets suggested Monday that the common ground that key senators from both parties said they’d secured on stablecoin yield seems to be intact.”We’re hopeful that the compromise that has been reached will be durable and will hold,” Witt said. “Solving that was a must-have before we could get onto the other outstanding issues,” which he said he’s now pivoted to, though some of the issues have already been resolved.
Apart from the question of yield on stablecoins, over which bankers had successfully convinced some in the Senate that their deposit base could be in peril, the Clarity Act had a number of other potential hangups. Among those have been the illicit financial protections in the decentralized finance (DeFi) space, and a request from Democrats that senior government officials (most pointedly, President Donald Trump) be barred from profiting off of the crypto sector.
Though Witt wouldn’t identify the topics that have been settled in the ongoing talks, he said that the negotiations “made considerable progress in the background” while the yield argument between banks and crypto firms got most of the attention.
“We’re very close to closing them out,” he said. “All of these issues felt intractable and unsolvable at one point in time. So the fact that we’ve been able to close out a lot of them gives me confidence that we can close out these other ones, too.”
The Clarity Act would need a markup hearing in the Senate Banking Committee before it can be advanced toward a final Senate vote. It had been close to such a hearing at the beginning of the year, but the bank lobbyists raised objections to stablecoin yield that delayed the process.
Last week, White House economists issued a report that downplayed the threats the banking sector contended are posed by giving stablecoin holders a return that resembles interest from a bank account. On Monday, the American Bankers Association answered back, saying the White House argument was flawed. Witt said the view of bankers is wide-ranging, depending on how close they are to the technology.
“They’re grappling with it,” he said. “These are all important issues to their members.
And, you know, some of them are going to view stablecoins more positively. Some are going to be a little bit more threatened by them.”
Read More: Trump’s crypto adviser rejects Jamie Dimon on treating yield-bearing stablecoins like banks
Establishing a strong Bitcoin (BTC) uptrend in 2026 remains a challenge, as exchange-traded fund (ETF) flows have shown limited growth since peaking above $60 billion in 2025.
At the same time, inflows to the gold ETF also dropped by nearly 25% in Q1 and the lack of a capital rotation into BTC signals muted institutional demand.
Bitcoin demand acceleration lacks pace
A recent report from Ecoinometrics shows a clear shift in the demand and persistence of Bitcoin exchange-traded fund (ETF) flows. Before the October 2025 price peak for BTC, ETF inflows often came in extended streaks, including a 15-day run of $4.4 billion in June 2025, which helped sustain upside momentum.
That consistency has faded in recent weeks. The recent direction of ETF flows has changed quickly, with inflow streaks lasting only a few days. Outflows have also clustered, reaching up to 10 consecutive days, totaling $3.2 billion in January, suggesting more reactive positioning.
Bitcoin ETF flows comparison 2025 and 2026. Source: Ecoinometrics/X
The cumulative data reinforces this slowdown. Bitcoin ETF flows have plateaued at $55–$60 billion in 2026, showing little net growth. Over the same period, gold ETF flows dropped sharply to near $45 billion from around $60 billion, without a corresponding pickup in Bitcoin demand.
Ecoinometrics explained that the Federal Reserve’s lack of relief reinforces the slowdown in demand. US Treasury yields have shifted higher across maturities, with the 30-year yield rising toward 4.9% from 4.7% six months ago, while the shorter durations (10-year bond yield) also moved to 4.3% from 3.8% in October 2025.
The elevated yields offer competitive returns, reducing the need for sustained ETF-driven exposure to Bitcoin. Ecoinometrics added,
“As long as the bond market holds this view, Bitcoin is operating without a liquidity tailwind. And without that tailwind, sustained upside becomes much harder to build.”
US Treasury yield chart. Source: Ecoinometrics/X
Related: Bernstein says Bitcoin market already priced in quantum risk
Will Bitcoin overcome a key resistance level?
Crypto trader Ardi explained that one reason the current BTC range near $74,000 refuses to break is that retail and professional traders show similar behavior. Long positions drop as the price tests resistance, while the short exposure increases.
Hyblock’s four-hour chart highlights this repeated pattern. Long accounts decline sharply at highs, while short positioning builds at the same levels. These flows treat upward moves as opportunities to exit rather than extend exposure.
BTC analysis by Ardi. Source: X
The profit-taking from longs meets fresh short entries in the order book. That interaction reinforces the upper boundary and interrupts attempts to retain the uptrend.
Ardi said that a shift would require stronger long-term accumulation near the resistance, where buyers absorb available supply rather than react to it. For now, the positioning data near $75,000 continues to cap each rally.
However, the above condition could soon change as early Bitcoin adopter Willy Woo noted the return of capital flows into BTC for the first time since January. In an X post, Woo said,
“Capital flows into BTC just flipped positive, first time since January. Liquidity is repairing… spot remains stable while derivatives after being destroyed 10 Oct is now making its second attempt at rebounding. 80k remains key test level.”
Related: Nigel Farage-backed Stack BTC adds $2.7M in Bitcoin to treasury
This article is produced in accordance with Cointelegraph’s Editorial Policy and is intended for informational purposes only. It does not constitute investment advice or recommendations. All investments and trades carry risk; readers are encouraged to conduct independent research before making any decisions. Cointelegraph makes no guarantees regarding the accuracy or completeness of the information presented, including forward-looking statements, and will not be liable for any loss or damage arising from reliance on this content.
Listed cryptocurrency firm Exodus Movement (EXOD) is suing W3C, the parent company of crypto card and payments specialists Baanx and Monovate, and its chief executive, Garth Howat, to complete its $175 million acquisition of W3C, agreed in November of last year.
A lawsuit in the Delaware Court of Chancery seeks to compel Howat to comply with obligations under the November 24, 2025 Stock Purchase Agreement.
Howat and W3C accepted $80 million worth of loans from Exodus upon signing the deal, with $10 million given to Howat personally, who then declared that they did not need to repay these loans, according to the lawsuit.
“Defendants Garth Howat and W3C are engaged in a blatant, reckless, and improper campaign to escape closing a transaction for the sale of W3C to Exodus that they had promised to complete in a binding agreement,” the lawsuit states.
“They have attempted to pilfer millions of dollars from one of their own subsidiaries. They have falsely backdated documents filed with government authorities. They have purported to summarily dismiss entire boards of directors, as well as the CEO and CFO of their key operating entity, and replace them with lackeys of their choosing, despite being precluded from doing so by the binding agreement,” it said.
Howat did not immediately respond to a request for comment.
W3C companies Baanx and Monovate were behind the Crypto Life digital asset cards business that worked with the likes of Mastercard and MetaMask.
JP Richardson, CEO and Co-founder of Exodus commented, “We have a binding agreement with W3C and expect it to be fully honored. We’re confident in the path forward and anticipate a swift resolution.”
Public infrastructure, regulatory foresight and private-sector dynamism have converged to create one of the most sophisticated and inclusive financial ecosystems in the emerging world. The following looks at Brazil and its unique fintech ecosystem.
As Latin America’s largest economy, Brazil combines industrial depth with natural resource wealth. Its economy, valued at $2.3 trillion, is anchored in a diversified base: agriculture (soybeans, coffee, beef), mining (iron ore), manufacturing, and a dominant services sector that consists of the likes of digital industries and financial services. The services sector accounts for nearly 60 per cent of the country’s gross domestic product (GDP).
In terms of GDP per capita, that is around $10,700, putting the country firmly in the upper-middle-income status. Its growing influence in the world can be seen in the likes of being a member in the BRICS group – which founding and early members include China, Russia, India and South Africa.
Speaking of financial services, the financial gravity is centred in São Paulo, Brazil’s largest city by population and is home to the B3 stock exchange, major banks such as Itaú Unibanco, and the nucleus of Brazil’s fintech ecosystem. Historically, this concentration reinforced financial depth but also exposed gaps in access across the broader population.
Digital economic transformation
Paulista avenue and a lot of buildings around in Sao Paolo IMAGE SOURGE GETTY
Brazil’s digital transformation has been deliberate, shaped by a view that financial infrastructure is a public good. Over the past decade, policymakers, led by the Banco Central do Brasil ((BCB) – Central Bank of Brazil in English)—have embedded digitalisation into wider economic development strategies.
At the core is Pix, the instant payment system launched in 2020 by the Central Bank of Brazil. This year, Pix processes over 6 billion transactions per month, with more than 170 million users, which is around three-fourths of the adult population. In value terms, the system moves roughly $550 billion each month, operating continuously and at minimal cost.
Pix is not merely a payments platform; it is a form of digital public infrastructure (DPI) that underpins economic participation. This scale has transformed economic behaviour. Payments, once costly and fragmented, eare now instant and accessible. Informal workers and small merchants have been brought into the formal financial system, while transaction costs have fallen sharply.
Pix has significantly reduced transaction costs, often to near zero, and enabled real-time payments across the economy. It is credited with bringing over 70 million people into the financial system, accelerating financial inclusion.
This transformation sits within a broader policy framework that includes: Expanding mobile and internet penetration; Encouraging digital identity and data-sharing systems; and Supporting innovation through regulatory sandboxes
Financial services sector: from incumbency to ecosystem
Brazil’s financial services sector has undergone a structural evolution. Historically dominated by a small group of large banks that controlled roughly 70 per cent of assets at its peak, the market is now more competitive and innovation-driven.
The fintech sector itself has grown rapidly, with estimates of up to 1,500 fintech companies operating across payments, lending, insurtech and wealthtech. This makes Brazil one of the largest fintech ecosystems in the developing world.
Digital transformation within the sector has been driven by key forces: mobile-first adoption, alternative credit models and embedded finance.
Several Brazilian fintechs illustrate this evolution and include the likes of Nubank (digital bank serving 110 million customers across LatAm), PicPay (digital wallet that has expanded into lending, insurance and payment infrastructure), PagSeguro (merchange acquiring and digital banking) and StoneCo (payment solutions mainly with small and medium enterprises (SMEs).
In terms of other catalysts and organizations, examples include the Associação Brasileira de Fintechs ((ABFintechs) Brazilian Fintech Association in English).
Central bank leadership: regulation as a catalyst
The role of the BCB has been important, acting both as regulator and infrastructure provider. Its approach has been to enable competition while maintaining stability, positioning Brazil as a global reference point in fintech policy.
Brazil has made inroads with Pix but the BCB and the country as a whole have done other successful progressive things in the wider digital space.
First, there is open finance. Brazil has built one of the world’s most advanced open finance ecosystems; it is regulated by the BCB.
Initially starting off mainly with open banking, it evolved into open finance, incorporating the likes of payments, insurance, and investments, with over 800 institutions with over 60 million active data-sharing consents. This allows consumers to securely share financial data, enabling personalised services and improved access to credit.
Second, there is Drex and digital currencies. The BCB is advancing Drex, which is the country’s central bank digital currency (CBDC), aimed at enabling programmable payments and tokenised financial assets. A phased rollout is expected through this year and into next year in 2027.
Beyond these initiatives, the central bank has introduced fintech licences, strengthened regulatory clarity, and supported innovation through sandbox environments. The result is a financial system where innovation is structured rather than fragmented.
Despite its progress, Brazil continues to face structural inclusion challenges, particularly in rural regions and among lower-income populations. Historically high fees, limited credit access and geographic barriers excluded millions. The combination of public infrastructure and private innovation has created a self-reinforcing cycle, where increased access drives adoption, and adoption drives further innovation.
Brazil’s fintech journey offers a clear lesson for emerging economies. Financial inclusion is not simply a byproduct of innovation but rather designed and scaled through coordinated policy and infrastructure that promotes wider financial inclusion and economic development.
Richie is a global economic development advisor and Managing Partner of Santos-Diaz LLC, specializing in international trade and foreign direct investment across the UK, Middle East, and North America. With over 15 years of experience and a Masters from SOAS University of London, he has advised high-level governments and multinational corporates while contributing to major outlets like Forbes and the World Economic Forum. Currently based in Dubai, he leverages his background in emerging markets and RegTech to bridge the gap between global policy and private sector growth.
View all posts
Executive Economic Development Advisor (Emerging Markets) | Contributor
Weekend panics followed by Monday reversals have become the norm in 2026, and the action over the last 48 hours has continued that pattern.
Down about 4% from late Saturday night into early Monday morning on news that U.S. Vice President J.D. Vance had left Pakistan without an Iran peace deal and President Trump’s ordering of a blockade of the Strait of Hormuz, bitcoin BTC$73,190.02 erased those losses in Monday U.S. action.
Trading at $73,400 as U.S. stocks closed for the day, bitcoin was higher by more than 3% over the last 24 hours. Ether (ETH), solana (SOL) and XRP (XRP) were also in the green, though posting slightly smaller gains than BTC.
Leading crypto-related stocks higher were Circle (CRCL), up 11%, Gemini (GEMI), up 9%, and MARA Holdings (MARA) and Bullish (BLSH), each up just over 8%.
In traditional markets, the Nasdaq was higher by 1.2%, and WTI crude oil had pulled all the way back to $98 per barrel after topping $105 at one point on Sunday.
No let-up from Strategy
Away from Middle East issues, Michael Saylor’s Strategy (MSTR) continues to hoover up bitcoin at a mighty pace. The company last week bought 13,927 BTC for $1 billion. Interestingly, Saylor and team issued no common stock to fund the purchases, but instead $1 billion worth of their STRC preferred stock, which yields 11.5%.
The action today in STRC suggests more big buys are coming this week. Volume Monday on STRC (when checked just before 3 pm ET) was a record $770 million. With the stock continuing to trade at par, it suggests sizable additional issuance by Strategy, and thus more large bitcoin buys.