
American Bitcoin, the Trump family-backed mining venture, is rapidly emerging as a significant player in the Bitcoin ecosystem, now holding approximately $450 million in BTC. With a treasury of 6,899 BTC, the company has climbed to become the 16th largest Bitcoin-holding corporate entity globally, surpassing several established industry participants and signaling an aggressive accumulation strategy.

This development comes at a critical moment for the mining sector. Bitcoin has been struggling to maintain momentum around the $70,000 level, creating a challenging environment for miners whose profitability is closely tied to both price stability and operational efficiency. In such conditions, mining companies face a strategic dilemma: liquidate holdings to cover costs or accumulate in anticipation of future upside.
American Bitcoin’s approach suggests a clear directional bet. By mining and holding rather than selling, the company is effectively positioning itself as a hybrid between a mining operation and a treasury vehicle. This strategy reflects confidence in Bitcoin’s long-term value, but it also introduces balance sheet risk if price volatility persists.
More broadly, this behavior highlights a shift within the mining industry, where capitalized players are increasingly using accumulation as a competitive edge, especially during periods of market uncertainty.
American Bitcoin Climbs Treasury Rankings as Market Reaches Inflection Point
American Bitcoin now holds 6,899 BTC, valued at approximately $486 million, placing it just ahead of Galaxy Digital, which holds 6,894 BTC. This marginal lead underscores how competitive the corporate treasury landscape has become, where even small differences in holdings can shift rankings significantly. The company’s next benchmark is GD Culture Group, which maintains a larger position of around $528 million in BTC, setting a clear near-term target.

This accumulation trend is unfolding at a pivotal moment for the Bitcoin market. After several weeks of consolidation around the $70,000 range, price action is approaching a critical inflection point. Market participants are increasingly focused on whether Bitcoin can sustain a breakout above resistance or face renewed selling pressure.
In this environment, corporate accumulation carries additional weight. Entities like American Bitcoin are not only absorbing supply, but also signaling long-term conviction at a time when short-term sentiment remains mixed.
Structurally, this creates a balanced but tense setup. While institutional accumulation supports the market from below, persistent uncertainty and profit-taking continue to cap upside, leaving BTC in a transitional phase where the next directional move could define the coming trend.
Bitcoin Consolidates Below Resistance After Sharp Correction
Bitcoin’s daily chart shows a market in consolidation following a decisive breakdown and partial recovery, with price currently stabilizing around the $70,000 level. After losing the $80,000–$85,000 support zone earlier in the year, BTC experienced a sharp selloff toward the $60,000–$65,000 range, where demand finally emerged.
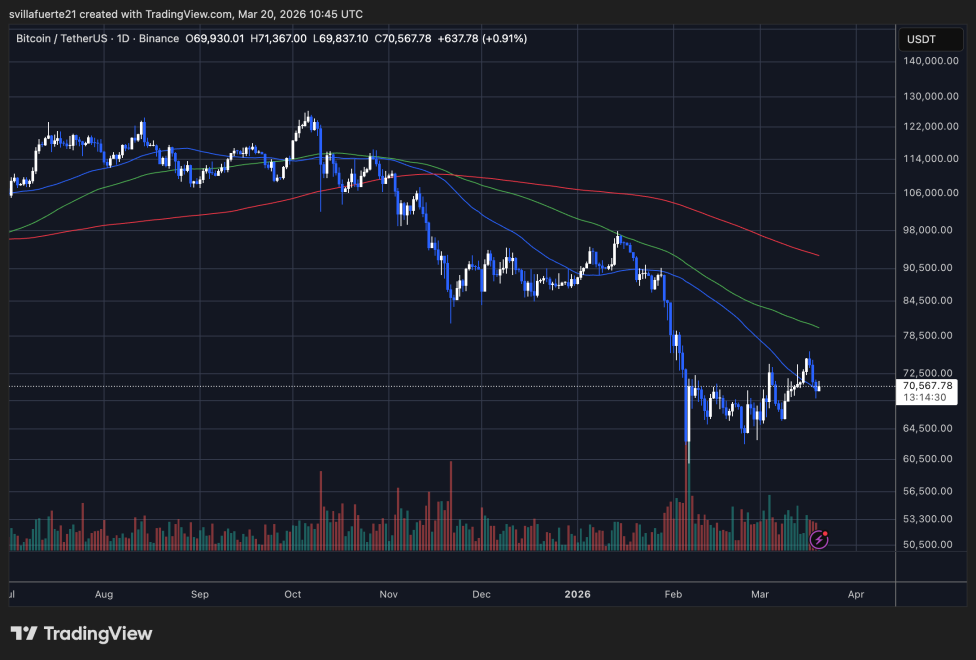
The rebound from those lows has been constructive but limited. Price is now trading below all major moving averages, including the 200-day, which continues to slope downward and acts as a key resistance level. The shorter-term averages are also declining, reinforcing the idea that the market remains in a corrective or transitional phase rather than a confirmed uptrend.
The $70,000–$72,000 region is currently acting as a short-term resistance zone, with multiple rejections suggesting that sellers are still active at these levels. At the same time, the $65,000 area appears to be forming a local support base, creating a narrowing range.
Volume analysis adds context. The selloff into February was accompanied by a significant spike, indicating capitulation and forced liquidations, while the recovery has occurred on more moderate volume, suggesting cautious participation.
For Bitcoin to regain bullish momentum, a sustained break above $75,000 is required.
Featured image from ChatGPT, chart from TradingView.com

Editorial Process for bitcoinist is centered on delivering thoroughly researched, accurate, and unbiased content. We uphold strict sourcing standards, and each page undergoes diligent review by our team of top technology experts and seasoned editors. This process ensures the integrity, relevance, and value of our content for our readers.