Trusted Editorial content, reviewed by leading industry experts and seasoned editors. Ad Disclosure
The price of Bitcoin saw a rise in bullish momentum over the past week, as the initially improving situation in the Middle East served as a significant catalyst. This optimism seems to have spread across the digital asset market, as fresh capital also flowed into the US-based spot Bitcoin ETFs (exchange-traded funds).
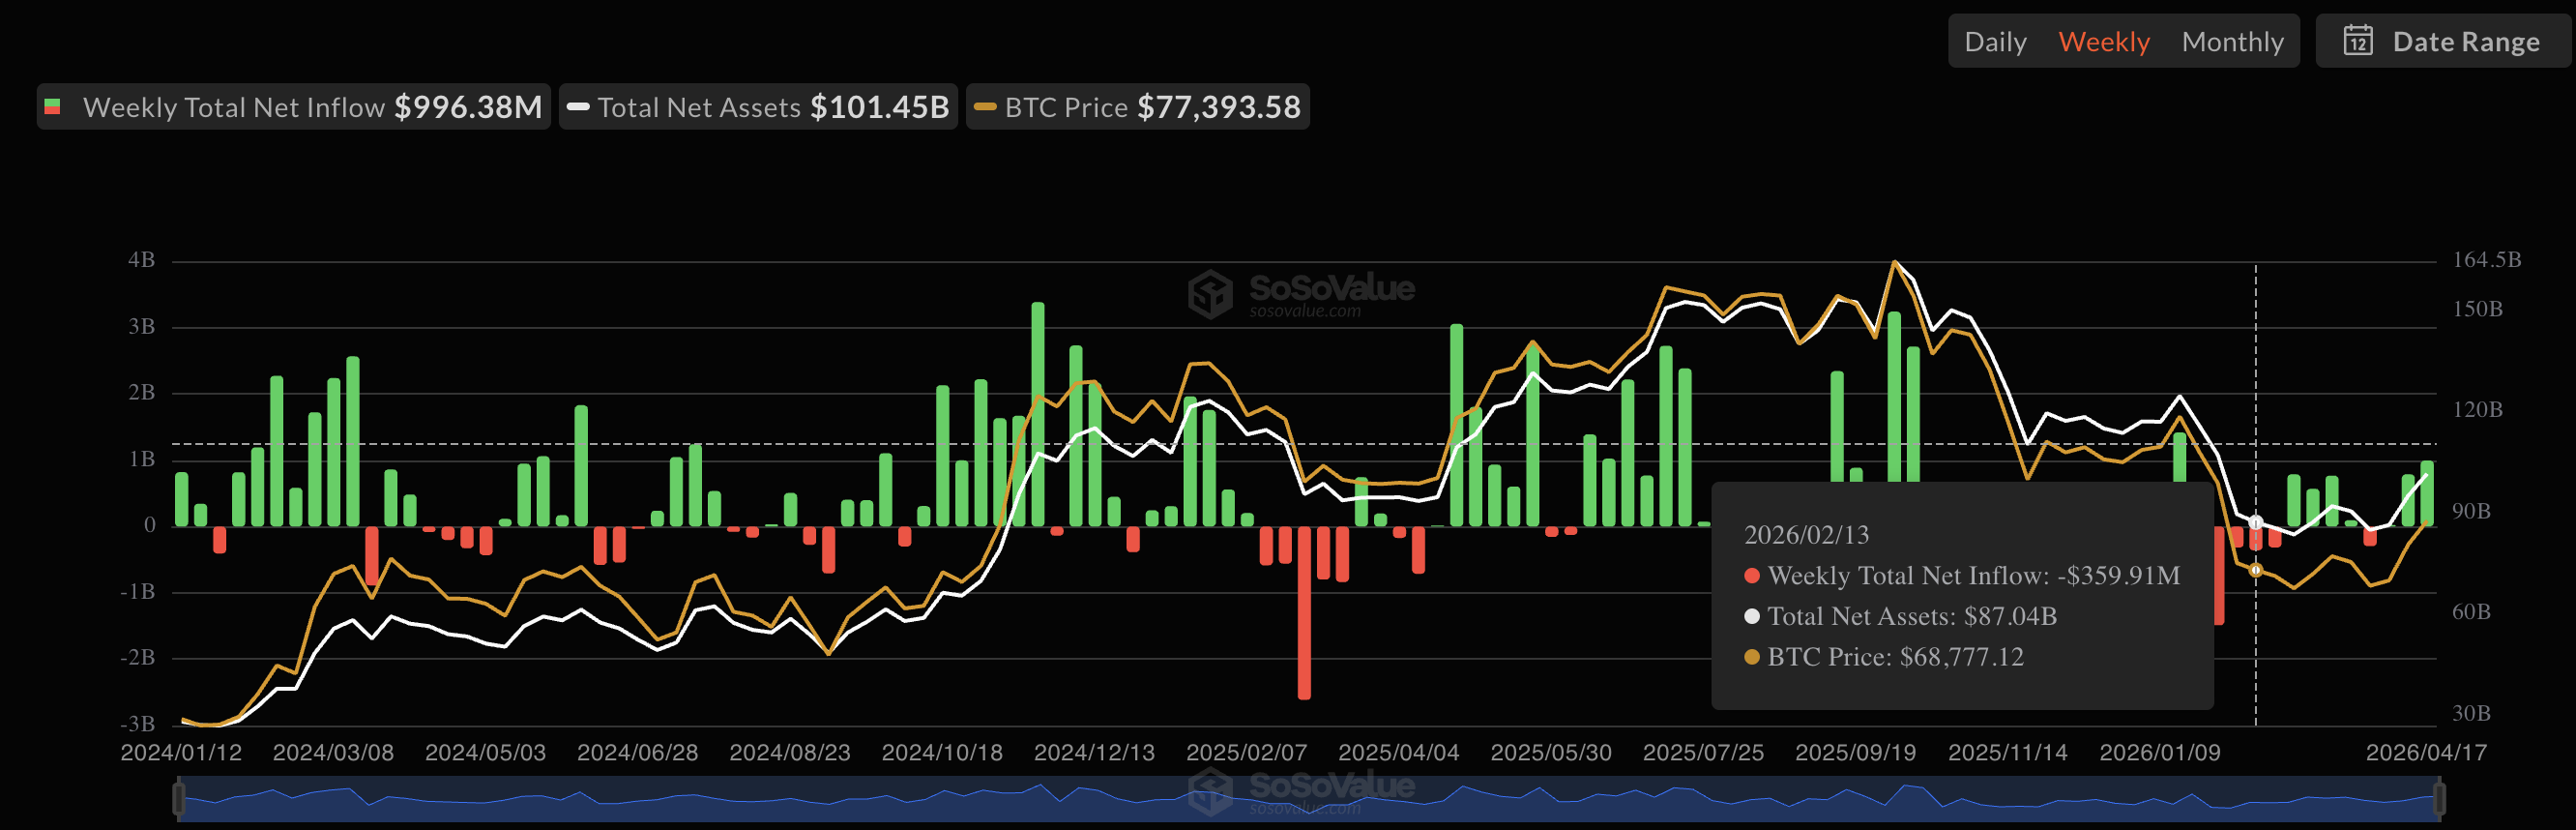
According to the latest market data, the spot BTC exchange-traded products saw the addition of nearly $1 billion in value over the past trading week. This fresh capital influx reflects an uptick in investor sentiment and demand over the past few weeks.
US Bitcoin ETFs Register $664M Net Inflows
On Friday, April 17th, the US-based Bitcoin ETFs recorded a total net inflow of $663.9 million, reflecting a return of investor demand into the market in recent weeks. This single-day performance marked the fourth consecutive day of inflows for the crypto-linked investment products.
Data from SoSoValue shows that BlackRock’s iShares Bitcoin Trust (IBIT) led the day’s activity, with a total net inflow of $283 million on Friday. This was followed by the Fidelity Wise Origin Bitcoin Fund (FBTC), which posted a $163.42 million net inflow on the day.
The Ark 21Shares Bitcoin ETF (ARKB) also registered a significant $117.9 million total net inflow on Friday. The other issuers with positive net inflows on the day included Grayscale Bitcoin Trust (GBTC), Grayscale Bitcoin Mini Trust (BTC), VanEck Bitcoin Trust (HODL), and Invesco Galaxy Bitcoin ETF (BTCO).
Their performances brought the weekly record of spot Bitcoin ETFs to around $996.38 million in net inflows, with the other weekly gains coming on Tuesday ($411.5 million) and on Wednesday ($186 million). Meanwhile, the past week’s activity represents the second-straight week of capital inflows, with $786.31 million net influx in the previous week.
Source: SoSoValue
This upturn in capital inflows is reflective of the easing tensions in the Middle East, with what seems like a return of positive sentiment into the market. According to data highlighted by on-chain analyst Darkfost, the BTC exchange-traded fund trading volumes are on the rise and currently stand at $4.7 billion, inching closer to spot market volumes, totaling at around $6.2 billion.
However, Darkfost noted that the average cost basis of the BTC ETF is around $82,247, with holders still at a loss. “Since March, the trend has shifted notably in a positive direction for ETFs, with inflows largely dominating,” the crypto analyst added.
Source: @Darkfost_Coc on X
Bitcoin Price At A Glance
As of this writing, the price of BTC stands at around $75,664, reflecting an over 2% decline in the past 24 hours.
The price of BTC on the daily timeframe | Source: BTCUSDT chart on TradingView
Featured image from Shutterstock, chart from TradingView
Editorial Process for bitcoinist is centered on delivering thoroughly researched, accurate, and unbiased content. We uphold strict sourcing standards, and each page undergoes diligent review by our team of top technology experts and seasoned editors. This process ensures the integrity, relevance, and value of our content for our readers.
The exploit of the Kelp liquid restaking protocol shows how non-isolated lending and integrations in decentralized finance (DeFi) can cause broader ecosystem contagion, according to crypto industry executives and blockchain security firms.
Non-isolated lending on DeFi platforms, including earlier versions of the Aave lending protocol, exposes users to risks from all the various tokens used as collateral on the platforms, according to Michael Egorov, founder of the Curve Finance DeFi protocol.
Kelp was the target of a cyber attack on Saturday, causing the platform to pause smart contracts for its restaking token (rsETH) while it moved to investigate the attack that left the platform drained of about $293 million.
DeFi teams should also vet prospective digital assets to ensure that tokens do not feature single points of failure or attack surfaces before approving tokens as lending collateral on their platforms, Egorov said in an email.
Source: Kelp
He also warned against using cross-chain bridging architecture to transfer assets from one blockchain protocol to another, which was the root cause of this weekend’s Kelp exploit.
“Cross-chain is hard and potentially risky. Only use cross-chain infrastructure when absolutely necessary, and do it really carefully,” Egorov said.
He said the incident is a learning experience for DeFi, which the sector can use to grow and implement better cybersecurity protections as losses from crypto hacks, code exploits and scams reached $482 million in Q1 2026.
Related: DAO behind CoW Swap urges users to stay off platform after ‘hijacking’
Kelp exploit triggers “contagion” across the DeFi ecosystem
“This was not just a protocol exploit. It immediately became a cross-protocol contagion event,” blockchain security firm Cyvers told Cointelegraph.
At least nine DeFi protocols and platforms, including Aave, Fluid, Compound Finance, SparkLend and Euler, were affected in the incident and took action to freeze rsETH markets or mitigate the fallout from the Kelp exploit, Cyvers said.
A map of the transfer of funds in the Kelp exploit. Source: Cyvers
“The challenge is no longer just preventing exploits at the contract level, but understanding how fast they can cascade across integrated protocols,” Cyvers CEO Deddy Lavid told Cointelegraph.
The exploit on Kelp followed the $280 million Drift Protocol decentralized exchange hack last week and at least 12 other crypto platforms and DeFi hacks earlier this month.
Magazine: ‘SEAL 911’ team of white hats formed to fight crypto hacks in real time
Cointelegraph is committed to independent, transparent journalism. This news article is produced in accordance with Cointelegraph’s Editorial Policy and aims to provide accurate and timely information. Readers are encouraged to verify information independently. Read our Editorial Policy https://cointelegraph.com/editorial-policy
Arthur Hayes just predicted that Hyperliquid could reach $150 as the exchange prepares to launch binary options trading through its HIP-4 upgrade. The BitMEX cofounder sees the new feature creating a wave of volume that would feed directly into the token’s buyback engine, and the hyperliquid price is already testing 2026 highs near $44 on the back of that prediction.
While HYPE builds its case for a major move, a different kind of opportunity is forming at a much earlier stage. Pepeto has raised over $9.2 million during extreme market fear, with a confirmed Binance listing approaching and exchange tools that already work while most presales are still selling future promises.
Arthur Hayes Predicts $150 HYPE as HIP-4 Binary Options Prepare to Launch
Hyperliquid Price Compared to Top Presale and Meme Coin Opportunities
Pepeto
The traders who missed early entries in major crypto rallies all share the same problem, they did not have the right information when it mattered. By the time an opportunity became obvious, the best prices were already gone.
Pepeto fixes that directly. The PepetoAI risk scorer rates every trade from entry to exit so traders know their exposure before they commit capital, and the cross chain bridge moves assets between networks so no opportunity gets missed because capital is stuck on the wrong chain.
While the hyperliquid price news shows a pullback below key levels, Pepeto’s tools are scanning the market to find entries before they reach public feeds. That kind of intelligence keeps working whether BTC is at $75,700 or $60,000, and that is what separates this project from tokens that only attract attention during rallies.
The visionary behind the original Pepe token and a former Binance expert designed the system, and a SolidProof audit confirms every contract is clean. With over $9.2 million raised and the Binance listing approaching, a small entry at current pricing carries the kind of return potential that the hyperliquid price at $44 and an $11 billion market cap simply cannot replicate.
HYPE Tests $44 as Buyback Engine Fuels Demand
The hyperliquid price sits near $44 per CoinGecko, up roughly 900% from its November 2024 launch price of $7.56 but still 26% below its September 2025 all time high of $59.37. Support holds at $40, with resistance between $44 and $50 according to CoinMarketCap. The exchange commands 44% of decentralized perpetuals market share, and 21Shares filed for a HYPE ETF on Nasdaq. The fundamentals are strong, but from an $11 billion market cap the path to $150 takes time and the percentage gain required is modest compared to what presale entries deliver.
DOGE Holds Near $0.95 With Limited Near Term Catalysts
Dogecoin trades near $0.95 per Coinbase, sitting 81% below its May 2021 all time high of $0.74. The unlimited supply continues to weigh on the price, and while community support remains deep, no new utility driver has emerged to push DOGE beyond its range. Support holds near $0.09, resistance at $0.18. The returns from $0.95 require a meme cycle that has not started yet, and even then the gains stay small compared to presale math.
The Bottom Line
The hyperliquid price earns every bit of attention it gets, with a working exchange processing trillions in volume and a buyback engine that ties growth directly to token demand. But even the bullish $150 target from Hayes represents 3.4x from current levels, a return that still takes quarters to arrive. Pepeto’s confirmed Binance listing compresses the entire timeline between presale pricing and exchange demand into a window that is closing faster than most traders realize, and every wallet that enters now sits on the other side of a listing that turns a small position into something the rest of the market chases at a higher price. After the listing opens, the entry that exists today never comes back.
Click To Visit Pepeto Website To Enter The Presale
FAQs
What is the hyperliquid price prediction for 2026?
The hyperliquid price is projected between $40 and $105 for 2026, with Arthur Hayes targeting $150 if the HIP-4 binary options upgrade drives the volume wave he expects.
Why is the hyperliquid price getting so much attention right now?
The hyperliquid price reflects an exchange generating nearly $1 billion in revenue with a buyback engine that ties every trade to token demand, but the $11 billion market cap limits the multiplier potential compared to presale entries.
Which presale is competing with the hyperliquid price for investor attention?
Pepeto has raised over $9.2 million with working exchange tools and a confirmed Binance listing, offering the kind of presale to listing return that mature tokens at $44 cannot deliver.
Three wallets, one denial, and $5.7 billion in market cap gone in 48 hours.
RaveDAO’s RAVE crashed by 90% over 24 hours after crypto exchanges Binance and Bitget opened investigations into trading activity that catapulted the token to a $6 billion market cap last week.
Bitget CEO Gracy Chen confirmed the probe on X, and Binance co-CEO Richard Teng subsequently said the exchange was reviewing the matter and would “always” do its part to examine signs of market misconduct. Gate.io was also named in the original allegations from onchain investigator ZachXBT, who has offered a $25,000 bounty for whistleblowers with evidence of the parties involved.
The collapse accelerated after the project’s Saturday denial rather than stabilizing on it.
RaveDAO posted a six-part X thread stating the team “is not engaged in, nor responsible for, recent price action.”
The thread did not address any of the specific onchain allegations that prompted the scrutiny, including the concentration of roughly 90% of the 1 billion RAVE supply across three Gnosis Safe multi-signature wallets attributed to the team, or the millions of tokens transferred to exchanges shortly before the rally began.
The original rally took RAVE from about $0.25 to $27.33 in nine days, a 10,800% move that triggered $44 million in liquidations on Friday, just behind bitcoin and ether, with the bulk of them from short sellers positioned against the token.
Investigators flagged a “bait and liquidate” pattern in which visible token transfers to exchanges suggested incoming sell pressure, drawing traders into short positions before those tokens were withdrawn and prices ripped higher, forcing shorts to cover at progressively worse levels.
RaveDAO presents itself as a Web3 entertainment platform offering onchain ticketing for electronic music events, tracing its origins to a 2023 Istanbul afterparty. The project reported about $3 million in 2025 revenue and lists partnerships with Binance, OKX, Bitget, and Polygon.
RaveDAO’s thread did confirm the team plans to “liquidate portions of unlocked tokens” when appropriate to fund operations and marketing, and said it was “exploring appropriate models, including price-triggered or performance-triggered locks, that tie team incentives to ecosystem growth.”
It did not commit to any specific lockup mechanism or timeline, however.
Stablecoins, the $300 billion class of digital dollars, may have started as a faster way to move money across the globe, but companies are now asking a different question: what can they actually do with them?
That shift is driving a new phase of adoption, according to Chunda McCain, co-founder of Paxos Labs, who says the industry is moving beyond basic infrastructure toward real business use cases.
“The first step was getting a stablecoin,” McCain said in an interview with CoinDesk. “The next question is: what now?”
Last week, Paxos Labs underscored that direction by raising $12 million in a strategic funding round led by Blockchain Capital, with participation from Robot Ventures, Maelstrom and Uniswap. The lab unit was incubated under Paxos, the New York-based digital asset firm behind popular stablecoins such as PayPal’s PYUSD (PYUSD) and the Global Dollar (USDG). Paxos itself builds stablecoins and the immediate underlying infrastructure, while Paxos Labs intends to build tooling for further use of those stablecoins.
With the fresh funds, Paxos Labs is building what it calls a “financial utility stack” that lets companies turn digital assets into products through a single integration.
Its newly launched Amplify Suite bundles three core tools: Earn, which offers yield on digital assets; Borrow, which enables lending against them; and Mint, which supports branded stablecoin issuance. The idea behind that is to let firms integrate tokens into a business, then layer on capabilities over time.
Turning cost into revenue
For years, enterprise crypto adoption focused on “first-touch” capabilities like trading, custody or issuing a stablecoin. Those steps opened the door but rarely generated returns on their own, according to McCain
“Stablecoins [have been] loss leaders for years,” he said.
The opportunity lies in how those assets are used. Payments are a clear example: merchants typically give up 2% to 3% in fees, while stablecoin rails can reduce those costs and even generate yield on balances held onchain.
“You turn what has always been a cost into revenue,” he said.
Some of the more novel use cases sit at the intersection of payments and credit. Payment providers already track merchant revenues and cash flow, which puts them in a position to underwrite loans, McCain argued.
That could allow merchants to access financing based on real-time performance, while earning yield on incoming payments and settling instantly across borders. These models are still early, but the building blocks are starting to come together, he said.
Not every firm needs its own token
To capture these benefits, not every firm needs its own stablecoin.
While companies like PayPal have launched branded tokens to control payments and margins, issuing one requires significant investment in liquidity, compliance and distribution.
“If you just need the economics, you don’t need to build your own,” McCain said.
Many firms can instead integrate existing stablecoins and still benefit from lower costs and added yield.
The shift may lack the hype when big firms like Western Union announce their own token, but it carries tangible impact on how businesses operate.
Stablecoins are starting to reshape margins, unlock credit and change how money moves globally, especially where traditional systems remain costly or slow.
“It might sound boring, but this is the math,” McCain said.
The following is the economic development, digital economic overview, and specifically, the fintech ecosystem of the country of Chile.
Chile’s fintech landscape in 2026 reflects a measured, institutional approach to digital transformation. This is less about disruption at scale, and more about strengthening an already mature financial system through innovation, regulation and competition. The result is a quietly effective model of financial inclusion and digital economic development.
The most stable economy in Latin America
Chile is widely regarded as one of Latin America’s most stable and advanced economies, underpinned by strong institutions and open-market policies. Its economy, now valued at approximately $350 billion, is anchored by mining (particularly copper, which accounts for over 50 per cent of exports), alongside agriculture, fisheries, manufacturing and a growing services sector.
The latter now contributes to over half of the country’s gross domestic product (GDP). In terms of GDP per capita, the country has the highest in Latin America at around $17,500, according to the World Bank.
As reflective of its growing services sector, which has been a country even until today mainly reliant on its strong mining sector, it has seen the country expand notably in Santiago. The capital and largest city of Chile hosts the country’s financial services cluster. It is home to some of the country’s largest financial services institutions like Banco de Crédito e Inversiones (BCI). In fact, the financial district in the Eastern part of the city is often known as “Sanhattan,” which has been the main cluster since the 1990s with its array of modern skyscrapers that look like a mini Manhattan.
Digital economic transformation: structured and policy-led
Conversation: Fintech Landscape in Chile IMAGE SOURCE GETTY
Chile’s digital transformation has been gradual but deliberate, supported by high levels of connectivity and institutional trust. With internet penetration exceeding 90 per cent, the country has built a strong foundation for digital services adoption.
Government strategy has focused on integrating digital technologies into broader economic development priorities, including: enhancing productivity and economic diversification beyond mining, expanding digital public services and e-government platforms, and supporting innovation ecosystems through public-private collaboration.
Chile is a member of the Organisation for Economic Co-operation and Development (OECD). According to them, Chile’s wider economic development agenda is often linked to innovation, green energy (particularly lithium and renewables), and digital services. This positions fintech as an enabling layer within a broader transformation strategy.
Financial services sector: digital evolution within a mature system
Chile’s financial system is among the most developed in Latin America, characterised by high levels of access and strong institutional frameworks. Approximately 98 per cent of adults have access to a bank account or financial product, one of the highest rates in the region, according to the World Bank. This is impressive considering back in 2011 it was only at 50 per cent.
Initiatives to get people in the financial system have been noticeable. For example, back in 2006, the state-owned bank Banco Estado introduced Cuenta RUT. This is a demand account featuring simplified opening procedures, no income prerequisites, and no maintenance fees. Banco Estado provides around 14.5 million Cuenta RUT accounts (equivalent to about 95 percent of the adult population).
This high baseline has shifted the role of fintech from expanding access to enhancing efficiency, reducing costs and improving user experience.
Digital transformation in the sector is being driven by the growth in digital payments and mobile wallets, expansion of e-commerce and online financial services, and increased use of data analytics for lending and personalization.
Chile’s fintech ecosystem is steadily expanding, with approximately up to 400 fintech companies operating across payments, lending, wealthtech and insurtech segments, according to FinteChile (Chilean Fintech Association – a major catalyst promoting the sector in the country).
A number of local fintechs highlight this evolution. They include the likes of Global66 (cross-border payments and digital account platform), Fintual (A digital wealth management platform), Khipu (payment initiation platform), and Tenpo (digital financial services platform offering wallets, prepaid cards and consumer financial products).
Central bank and regulatory leadership: enabling innovation
The Banco Central de Chile (BCC – Central Bank of Chile) and financial regulators have adopted a balanced approach to fintech. encouraging innovation while maintaining financial stability.
A key milestone has been the introduction of Chile’s Fintech Law (Ley Fintech, Law No. 21,521). It became effective in 2023 and also aims to promote competition and financial innovation, improve customer protection, data protection, and cybersecurity, and prevent money laundering and financing of terrorism. Its three aims are to regulate fintech activities, establish an open finance system, and regulate crypto assets.
In parallel, Chile is advancing towards open finance, with regulatory efforts aimed at enabling secure data-sharing across financial institutions. This is expected to improve access to credit and foster competition.
The Comisión para el Mercado Financiero ((CMF) – Financial Market Commission in English), published regulations that will govern the Open Finance System (Sistema de Finanzas Abiertas or SFA in Spanish) under the Fintech Law, which will take effect in July this year. Regulated institutions in the financial system—such as banks, card issuers, insurance companies, fund managers, and savings and credit cooperatives supervised by the CMF, will be obligated to join the SFA.
In payments, digital adoption continues to rise, supported by strong infrastructure and consumer trust. While Chile does not yet have an instant payment system at the scale of Brazil’s Pix, the ecosystem is moving towards faster, interoperable and lower-cost digital payments.
The BCC has also explored the feasibility of a central bank digital currency (CBDC), signalling a forward-looking approach to financial innovation.
Chile’s financial inclusion challenge is less about access and more about quality and depth of participation. While most adults are banked, disparities remain in access to affordable credit for small and medium enterprises (SMEs), inclusion for informal workers, and financial literacy amongst the lower-income populations. It is worth mentioning, despite the progress Chile has made in become the richest country in Latin America by GDP per capita, disparities and inequality remain between rich and poor. These are avenues where the likes of fintech can further boost digital economic prosperity in the areas mentioned.
Chile’s fintech journey offers a distinct lesson within Latin America. It demonstrates that financial transformation does not always require rapid disruption; it can emerge through steady, well-regulated innovation built on strong institutional foundations.
Mixed signals from US and Iranian sources characterized the weekend, with an assumed ceasefire and mutual agreements between the two sides now seemingly undone.
Among the latest developments was the repeat closure of the Strait of Hormuz, putting the focus on oil futures on the day. News of a ceasefire had sent WTI crude below $80 per barrel for the first time since March 10.
“We expect an eventful Sunday ahead,” trading resource The Kobeissi Letter summarized in ongoing analysis on X.
CFDs on WTI crude oil one-day chart. Source: Cointelegraph/TradingView
As BTC/USD circled local highs, and sentiment with it, market participants stayed cautious. Trading resource Material Indicators noted that the entire market mood could flip on relatively little input, such as a social media post.
“Sentiment is overwhelmingly bullish at the moment, but that could change with one Tweet in the coming days. Know your invalidations,” it told X followers.
Data from CoinGlass showed long positions coming under fire during the BTC price retracement, with total crypto liquidations at $260 million over the past 24 hours.
Crypto seven-day liquidation history (screenshot). Source: CoinGlass
BTC price capped by resistance trend line
Continuing, trader Daan Crypto Trades eyed a potential gap in CME Group’s Bitcoin futures market opening as a result of the weekend comedown.
Related: Bitcoin can grow ‘probably a lot bigger’ than $30T+ gold market — Analysis
As Cointelegraph reported, such gaps often act as short-term price magnets when the new week begins.
“It’s going to be interesting to see the futures open today and how $OIL will react to the recent headlines regarding the strait,” he added.
Looking at the weekly close, trader and analyst Rekt Capital placed importance on Bitcoin’s 21-week exponential moving average (EMA) near $78,900.
“Bitcoin is rejecting from the 21-week EMA (green),” he observed alongside the weekly chart.
“It is this rejection that could force a post-breakout retest of the top of the Double Bottom (~$73k) next week, provided Bitcoin Weekly Closes just like this.”
BTC/USD one-week chart. Source: Rekt Capital/X
This article is produced in accordance with Cointelegraph’s Editorial Policy and is intended for informational purposes only. It does not constitute investment advice or recommendations. All investments and trades carry risk; readers are encouraged to conduct independent research before making any decisions. Cointelegraph makes no guarantees regarding the accuracy or completeness of the information presented, including forward-looking statements, and will not be liable for any loss or damage arising from reliance on this content.
As household energy arrears climb above £4bn, Ren Yi Hooi, CEO at Lightning Reach, argues that falling behind on energy bills is one of the clearest early indicators of deeper financial instability, and should trigger earlier, more coordinated intervention.
Household energy bills fell by approximately 7% in April 2026, following Ofgem’s announcement of a lower price cap after the government scrapped the Energy Company Obligation (Eco) scheme. Alongside this, the regulator has consulted on a Debt Relief Scheme
aimed at helping vulnerable households clear historic energy debt.
Yet despite these developments, UK households now owe a record £4.4 billion in energy debt and arrears, according to Ofgem, an increase of more than £750
million in a year and the highest level to date.
Energy arrears are rarely an isolated problem. While often framed purely as a utilities issue, driven by price volatility and the structure of the Ofgem energy price cap, falling behind on energy bills can be one of the first visible signs that wider financial
pressure is already taking hold.
A signal of wider financial vulnerability
Analysis from Lightning Reach of over 280,000 financially vulnerable people shows a strong relationship between energy debt and other forms of financial difficulty. Households struggling with energy costs are twice as likely to have difficulty keeping up
with loan repayments. On top of this, they’re more than four times as likely to struggle with water bills, over 50 per cent more likely to fall behind on housing costs and two and a half times more likely to have difficulty paying council tax.
This tells us that energy debt is not a standalone event, and part of a broader picture of constrained budgets and limited financial resilience. By the time a household falls behind on their energy payments, other pressures, including non-priority debt,
are often already mounting.
The impact also isn’t evenly distributed. Over half of those in energy debt have dependent children. People who report a disability are also 12% more likely to face energy difficulties than those who do not. These findings reflect a wider
pattern of hardship facing households who are rationing heating and hot water in order to cope with rising bills.
Energy debt, then, provides visibility into the cracks in a system under severe strain.
Price controls cannot solve structural pressure
The Ofgem energy price cap, set at an average of £1,758 for the first quarter of 2026, has provided important protection for consumers.
However, stabilising prices does not automatically resolve accumulated debt or restore financial resilience.
More than one million households are currently behind on their bills without an agreed repayment plan in place. This points to a more entrenched challenge.
Even where wholesale prices have moderated, many households are still carrying the legacy of previous increases, alongside higher costs in other essential areas.
A fragmented system
One of the reasons early warning signs are missed is that the system designed to provide support is itself fragmented.
Local authorities, utilities and support organisations often operate in silos, using legacy technology that doesn’t communicate effectively across departments. A household may be behind on council tax, struggling with energy bills and applying for discretionary
support, yet no single organisation has full visibility of the whole picture.
Councils are under acute financial pressure, with limited budgets and overstretched teams, but too much time is spent on administration and navigating disconnected systems, leaving less capacity for preventative outreach. Support services typically intervene
only once arrears have escalated, rather than when the first signs of strain emerge.
Without joined-up data and coordinated processes, early indicators such as energy arrears are treated as isolated events instead of signals of wider vulnerability.
Moving from recovery to earlier support
Recognising energy arrears as an early indicator creates an opportunity to rethink how support is delivered. There have been positive developments, including the Warm Homes Discount, but energy debt relief alone will not address the underlying fragility
if households are already facing pressure across several fronts by the time they qualify.
A more preventative approach is necessary. When a household falls behind on energy payments, that data should act as a trigger, prompting a wider check and enabling earlier, coordinated intervention from suppliers, local authorities and support services,
before it escalates.
Technology can support this shift by removing friction from fragmented systems, helping households navigate available assistance more easily and by enabling practitioners to identify patterns of need. When systems are better connected, support can be delivered
in a way that reflects the reality of household finances rather than responding to a single overdue bill.
For those working across utilities, councils and financial support organisations, the challenge is not simply to manage arrears but to understand what they represent. It is often the clearest early signal that a household is under wider strain. Acting on
that signal in time can make the difference between temporary difficulty and prolonged financial crisis that some may struggle to make their way out of.
Aave just watched $6.6 billion walk out the door, and it’s not because anyone hacked Aave.
The protocol’s total value locked dropped from $26.4 billion on April 18 to nearly $20 billion in U.S. morning hours on Sunday, per DefiLlama. The AAVE token fell 16% to $92, and daily fees spiked to $1.99 million as liquidations ripped through the weekend.
Depositors are running because Aave is carrying a hole it did not create. When attackers drained 116,500 rsETH from Kelp’s bridge on Saturday, they dumped the stolen tokens on Aave V3 as collateral and borrowed wrapped ether against them.
On-chain trackers put the Aave-specific borrow at roughly $196 million, with total positions across Aave, Compound and Euler around $236 million.
Aave is the largest lending protocol in DeFi, where users deposit crypto to earn yield and other users borrow against collateral. Kelp is a liquid restaking protocol, which takes ether that has already been staked on Ethereum and routes it through a separate yield-generating system called EigenLayer, issuing a receipt token called rsETH in exchange.
That rsETH is what users trade and, critically, what some users posted on Aave as collateral to borrow against.
On Saturday, attackers tricked Kelp’s cross-chain bridge into releasing 116,500 rsETH, about $292 million worth, to an address they controlled. They then deposited that stolen rsETH onto Aave V3 as collateral and borrowed wrapped ether against it.
A bridge is a blockchain-based took that transfers tokens between different networks, where they may not be originally supported.
Aave first said the Umbrella reserve would cover any deficit. By Saturday afternoon the language had softened to “explore paths to offset the deficit.” That is not how a protocol talks when it knows how much it owes and has the money to pay it.
The concentration explains why the damage lands here. Aave’s loan book spans 22 chains, but Ethereum alone holds $14.24 billion of the $17.82 billion in outstanding borrows. WETH is 39.49% of all loans on the protocol, meaning the attack hit the exact collateral-to-WETH pair that dominates Aave’s book.
Stani Kulechov, Aave’s founder, said the exploit was external and the protocol’s contracts were not compromised. But Aave accepted a liquid restaking token as collateral, and that token’s backing vanished on a bridge Aave does not control. The depositors lose either way.
Liquid restaking tokens were whitelisted across every major lending protocol because they carried yield and represented growing share of Ethereum’s locked value.
The risk models priced them as if they would hold peg under normal conditions. However, none of them priced a scenario where the collateral goes to zero because a bridge on a chain Aave does not touch got exploited on a Saturday.
“AAVE is the backbone of DeFi, has billions in there, and pretty much every single new DeFi infrastructure on new chains is a fork of it,” trader Altcoin Sherpa wrote on X. “When AAVE has contagion risk, it shows the fragility of the entire system.”
What the token price is trying to answer now is whether Umbrella is big enough to cover the hole, and whether stkAAVE holders who back that reserve are about to eat the loss.
France is facing a rise in crypto-related kidnappings as so-called “wrench attacks” become more frequent, brazen and violent.
That shift was visible this week amid the staging of an annual international blockchain and crypto conference. A police motorcade escorted VIP guests to a dinner at the Palace of Versailles. And security was also notably reinforced at the Carrousel du Louver, where the conference was taking place.
Wrench attacks in France have put the country so notably under the international spotlight that government officials took the stage at the conference in Paris to acknowledge their alarm at the scale of the problem. They said that this year alone, the country has suffered at least 41 crypto-related kidnappings and home invasions. That’s one every two to three days.
Jean-Didier Berger, Minister Delegate to the Interior Ministry, said a new set of measures is being prepared with Interior Minister Laurent Nuñez to tackle the growing issue. A prevention platform has already drawn thousands of registrations, but authorities say further steps are needed as incidents continue to rise.
Wrench attack epicenter
The country has become the epicenter of a global rise in wrench attacks. Across multiple jurisdictions, attacks on crypto holders are becoming more frequent and more violent, according to security researchers and law enforcement data.
Globally, the trend is also on the rise. In 2025, there were 72 verified physical coercion incidents globally, a 75% increase from the previous year, according to Certik and crypto researcher Jameson Lopp’s data, which tracks 188 attacks since 2014. Many more go unreported, he said. Cases involving physical assault rose even faster, up 250% year-over-year.
The term “wrench attack” refers to the use of physical force to extract access to digital assets. For some attackers, it is easier to coerce a person than to break encryption.
“Every time a wrench attack is successful, it tells the world that crypto owners are juicy targets,” Lopp told CoinDesk.
Unlike traditional bank transfers, crypto transactions cannot be reversed. Once a victim authorizes a transfer under duress, the funds can be moved quickly across wallets and chains.
Attackers seek points of weakness
Researchers say the way attackers identify victims has also changed.
“We’re seeing a shift from ‘find a wallet’ to ‘hunt a person,’” Phil Ariss of TRM Labs told CoinDesk. Rather than scanning for technical vulnerabilities, attackers build profiles, he added. They look at social media activity, public appearances and leaked datasets. They track routines and identify points of weakness.
“The biggest avoidable mistake is tying real-world identity, location and routine too tightly to visible crypto wealth,” Ariss said.
The problem is exacerbated when attackers get a helping hand from government officials. In one widely known case, in which a French tax official sold wrench attackers sensitive data. The case raised concerns among security experts that insider leaks and compromised state data were feeding directly into wrench attacks.
The pool of potential victims has widened, with mid-level holders increasingly being targeted, sometimes based on limited or indirect signals.
Anybody is a potential victim
Cases now include families, with children targeted alongside crypto-holding parents, making the attacks harder to categorize by severity.
In January 2025, Ledger co-founder David Balland was kidnapped in France along with his partner. During the attack, one of his fingers was severed and sent to associates as part of a ransom demand. He was rescued after a police operation.
Other cases have involved prolonged captivity and torture, such as one in New York, where a crypto investor was held for more than two weeks. In Canada, a home invasion escalated into waterboarding and sexual violence as attackers attempted to force access to funds.
Lopp said both opportunistic and organized groups are involved, but there are signs of increasing coordination. “We do seem to be seeing more organized groups now,” he said.
TRM Labs’s Ariss says his team has observed similar patterns, noting some groups operate with defined roles and pre-planning, including surveillance and follow-home tactics.
“These look less like one-off robberies and more like small kidnap or robbery crews specializing in crypto jobs,” Ariss said.
After funds are obtained, attackers tend to move quickly and frequently the crypto assets they attain are converted into stablecoins and routed across multiple chains, making recovery more difficult.
France’s role in this trend may reflect a mix of factors, Lopp said, including cases involving leaked personal data and cross-border criminal networks.
Rising prices, heftier loot
More broadly, rising asset prices have increased the potential payoff from a single attack, while improvements in digital security have reduced the effectiveness of purely technical exploits.
“It’s far easier than trying to rob a bank,” Lopp said.
Another issue is visibility: wrench attacks might be significantly underreported because many are reported as standard robberies or home invasions, with no mention of crypto.
“A large share of incidents are still recorded as simple robberies,” Ariss said, adding that the crypto element is often left out at the time of reporting, which can make it harder for authorities to connect cases or identify broader patterns.
The increase in attacks has raised questions about the risks of self-custody, a core principle of cryptocurrency.
Some security experts point to measures such as multi-signature setups, withdrawal delays and spending limits as ways to reduce risk by limiting how much can be accessed under duress.
“If coercion cannot produce immediate access to the majority of funds, the risk and return changes,” Ariss said. Such measures do not eliminate the threat but may reduce the incentive for attackers.
As crypto adoption grows, attacks are becoming more frequent and severe, turning what was once a niche concern into a broader security risk.