Home Blog Page 295

Saylor’s Strategy Could Buy $30 Billion In Bitcoin This Year

0

Trusted Editorial content, reviewed by leading industry experts and seasoned editors. Ad Disclosure

Michael Saylor’s Strategy could buy roughly $30 billion worth of bitcoin this year if its current acquisition pace holds, according to JPMorgan analysts, marking a potential acceleration beyond the company’s already aggressive treasury playbook.

The estimate comes after Strategy added 145,834 BTC so far this year, worth around $11 billion, with JPMorgan noting that much of the buying occurred while BTC traded below the company’s estimated average cost of roughly $75,000. At the current annualized pace, the bank said Strategy’s 2026 purchases would exceed the approximately $22 billion it bought in each of 2024 and 2025.

JPMorgan Sees Bitcoin Buying Spree Reacceleration

The latest call centers on the speed of Strategy’s buying, not merely the size of its balance sheet. JPMorgan analysts led by Nikolaos Panigirtzoglou said the company “appears to have accelerated its Bitcoin purchases again in April,” extending what they described as an opportunity-driven pattern this year.

“Strategy appears to have accelerated its Bitcoin purchases again in April,” the analysts said, according to summaries of the note. “The company is pursuing an opportunity-driven buying strategy throughout 2026, sensitive to market conditions and funding opportunities.”

That framing is important. Strategy is not simply buying on a fixed schedule. JPMorgan’s read is that the company has been using price weakness and available financing windows to expand its bitcoin stack, while its stock-market premium gives it a capital-raising mechanism that most corporate bitcoin holders do not have.

Strategy’s premium to net asset value has expanded to around 26% over the past two months, according to reports citing JPMorgan. A larger premium can make equity or debt issuance more attractive, because the company can raise capital above the implied value of the bitcoin it already holds and recycle proceeds into additional BTC purchases.

Strategy’s Balance Sheet Keeps Growing

Strategy said on May 5 that it held 818,334 BTC as of May 3, representing 22% year-to-date growth. The company also reported $11.68 billion raised year to date, while STRC alone had raised $5.58 billion and cumulative dividends declared and paid on preferred stock had reached $692.5 million.

The company’s own commentary emphasizes the funding side of the model. CEO Phong Le said, “Adoption of Bitcoin continues to grow in 2026. Digital Credit, highlighted by STRC, has been a big success. STRC has shown strong demand, high liquidity, and low volatility.” He added that Strategy raised $5.6 billion in year-to-date STRC gross proceeds and cited growing bitcoin activity from major banks including Morgan Stanley, Goldman Sachs and Citi.

CFO Andrew Kang framed the preferred-equity platform as a core part of the company’s capital structure. “Strategy is the dominant issuer of Digital Credit in the world, with over $13.5 billion of preferred equity outstanding, supported by a fortress Bitcoin balance sheet,” he said. “We continue to extend our track record of servicing our dividends, having now met our payment obligations on time and in full across 23 consecutive distributions, totaling over $693 million since the launch of our preferred equity products in early 2025.”

The Trade-Off: Bigger Purchases, Bigger Obligations

The same structure that enables larger bitcoin purchases also increases Strategy’s ongoing obligations. The company reported a first-quarter net loss of $12.54 billion, or $38.25 per share, driven by a $14.46 billion unrealized loss on digital assets. Strategy’s filings also state that perpetual preferred stock dividends must be paid in perpetuity, and that future obligations could require the company to sell common stock or bitcoin.

That tension has become harder to ignore after Saylor signaled that Strategy could sell some bitcoin to pay preferred dividends, even as he later summarized the firm’s stance in a six-word post: “Buy more bitcoin than you sell.”

At press time, BTC traded at $79,934.

Bitcoin price chart
BTC bulls eye the 0.786 Fib, 1-week chart | Source: BTCUSDT on TradingView.com

featured image created with DALL.E, chart from TradingView.com

Editorial Process for bitcoinist is centered on delivering thoroughly researched, accurate, and unbiased content. We uphold strict sourcing standards, and each page undergoes diligent review by our team of top technology experts and seasoned editors. This process ensures the integrity, relevance, and value of our content for our readers.

Mantle Tokenholders Back Aave Credit Facility After rsETH Exploit

0

Mantle tokenholders backed a proposal authorizing a credit facility of up to 30,000 Ether (ETH), worth about $68 million, for Aave DAO, advancing remediation tied to bad debt from the April rsETH exploit.

The proposal, MIP-34, passed in a seven-day Snapshot vote that ended Friday, according to DAO governance platform Snapshot. The measure authorizes the Mantle Foundation to negotiate and execute definitive agreements with Aave DAO for a loan from the Mantle Treasury, though the facility remains subject to Aave implementing its recovery plan and the parties finalizing terms.

The credit facility is intended to help address the impact of the rsETH incident on Aave V3. The proposal said the attacker deposited 89,567 unbacked rsETH on Aave and borrowed about $190 million in WETH, wstETH and stablecoins, creating potential bad debt estimated at between $123.7 million and $230.1 million.

The vote comes as the fallout from the rsETH exploit has moved beyond the initial liquidity shock into a broader remediation phase, with Mantle positioning its treasury as a backstop while Aave works to address bad debt and restore confidence in its lending markets. 

Source: Aave

Aave WETH market cools after post-exploit squeeze 

The Mantle credit facility would address the shortfall that also created liquidity stress across Aave’s lending markets.

Galaxy Research said in a Thursday report that the rsETH exploit pushed Aave’s Wrapped Ether (WETH) market into a prolonged squeeze, with WETH utilization staying above 99% for 12.7 days after the incident. 

“Across the full analysis horizon, WETH utilization stayed structurally elevated and close to the 100% ceiling, with an average around 99.6% and only easing to about 98.47% by the end of the snapshot period,” Galaxy said. 

Related: Aave asks Arbitrum to send 30K ETH from Kelp exploiter to ‘DeFi United’

High utilization means most of the supplied asset has already been borrowed, leaving little idle liquidity available for immediate withdrawals. In Aave’s case, Galaxy said the WETH market remained strained because supply contracted faster than borrows declined, keeping utilization near full capacity even after the initial shock. 

30-day WETH utilization rate chart. Source: Aavescan

The market has since cooled from the near-100% levels described in Galaxy’s analysis. Aavescan data showed Aave’s Ethereum V3 WETH market at about 91.6% utilization on Friday, with roughly 2.02 million WETH supplied and 1.85 million WETH borrowed. 

Magazine: North Korea denies crypto hacks, Upbit’s bank tests Ripple: Asia Express

Cointelegraph is committed to independent, transparent journalism. This news article is produced in accordance with Cointelegraph’s Editorial Policy and aims to provide accurate and timely information. Readers are encouraged to verify information independently.

NEAR Protocol (NEAR) gains 6.3%, leading index higher

0

CoinDesk Indices presents its daily market update, highlighting the performance of leaders and laggards in the CoinDesk 20 Index.

The CoinDesk 20 is currently trading at 2142.44, up 0.1% (+2.73) since 4 p.m. ET on Thursday.

Seventeen of 20 assets are trading higher.

Leaders: NEAR (+6.3%) and ICP (+5.8%).

Laggards: BNB (-0.4%) and CRO (-0.1%).

The CoinDesk 20 is a broad-based index traded on multiple platforms in several regions globally.

Bitcoin Rallies, But Traders Still Realizing $479M In Losses

0

Trusted Editorial content, reviewed by leading industry experts and seasoned editors. Ad Disclosure

On-chain data shows the Bitcoin Realized Loss indicator has remained elevated even after the latest surge in the cryptocurrency’s price.

Bitcoin Realized Loss Has Stood At $479M Per Day Recently

In its latest weekly report, on-chain analytics firm Glassnode has discussed the latest trend in the Realized Loss for the Bitcoin network. The “Realized Loss” here refers to an indicator that measures, as its name suggests, the total amount of loss that BTC investors as a whole are realizing through their transactions.

The metric works by going through the transfer history of each token being moved to see what price it was transacted at prior to this. If the last selling price was less than the latest one for any token, then that particular token’s sale can be considered to be leading to the realization of some net loss.

The exact degree of loss involved in the transfer is equal to the difference between the two prices. The Realized Loss calculates the sum of this difference for all loss transactions occurring on the blockchain. A counterpart indicator called the Realized Profit takes care of the transfers of the opposite type.

Now, here is the chart shared by Glassnode that shows the trend in the 14-day simple moving average (SMA) of the Bitcoin Realized Loss over the last few years:

Bitcoin Realized Loss

The value of the metric appears to have registered a spike in recent days | Source: Glassnode's The Week Onchain - Week 18, 2026

As displayed in the above graph, the 14-day SMA of the Bitcoin Realized Loss witnessed massive spikes as the cryptocurrency saw price crashes in November and February.

These spikes weren’t anything unusual, as price drawdowns tend to accompany panic selling from top buyers. Interestingly, however, another spike has just recently appeared in the indicator, despite the fact that BTC has been rallying.

The spike is nowhere near of a scale similar to the earlier capitulation events, but it’s nonetheless an indication that there has been a greater push to exit below cost basis alongside the price surge. This may suggest that investors don’t believe that the price rally would last, hence why they have decided to exit at this lower-loss opportunity.

Currently, the Realized Profit is sitting at $479 million per day, approximately 140% above the $200 million baseline that has generally been seen during stable phases in this Bitcoin cycle.

The analytics firm explained:

A sustained compression of this indicator back below $200M per day would serve as a strong on-chain confirmation that selling exhaustion is taking hold, and that the market is genuinely transitioning toward a healthier demand regime.

BTC Price

At the time of writing, Bitcoin is trading around $80,100, up 5% over the past week.

Bitcoin Price Chart

Looks like the price of the coin has retraced from its latest high | Source: BTCUSDT on TradingView

Featured image from Dall-E, chart from TradingView.com

Editorial Process for bitcoinist is centered on delivering thoroughly researched, accurate, and unbiased content. We uphold strict sourcing standards, and each page undergoes diligent review by our team of top technology experts and seasoned editors. This process ensures the integrity, relevance, and value of our content for our readers.
Coinbase disruption tied to AWS outage draws criticism amid staff layoffs and Q1 losses

0

Coinbase (COIN) reported a multi-hour disruption to crypto trading on Thursday, which the Nasdaq-listed exchange attributed to an outage at Amazon Web Services. The incident drew criticism as Coinbase continues to grapple with declining trading activity, quarterly losses, and staff layoffs.

The crypto trading platform said users were unable to transact across web and mobile services after failures hit multiple AWS availability zones in the U.S. Eastern Region, located in Virginia.

“Coinbase experienced service disruptions due to increased temperatures in the affected AWS service,” the trading platform said in a status-page update. Trading was later restored after markets were briefly placed into a “cancel only” mode.

“This primary issue is now fully resolved – thank you for your patience,” said Coinbase on Friday in an X post, adding its team would investigate the incident. “Details may change as our investigation progresses and more information is received from AWS’s official retrospective, once published.”

In a separate statement on X, Coinbase said systems initially flagged “high error rates across multiple services,” and engineers traced the issue to failures in AWS infrastructure.

“Coinbase systems are designed to be resilient to a single zone outage,” the company said. “In this case, we observed failures impacting multiple AWS zones, which caused an extended outage of core trading services.”

However, the disruption drew criticism from software engineer Gergely Orosz, formerly at Uber and Skype, who has over 310,000 followers on X.

“Unfortunate optics for Coinbase to have an hours-long outage when customers could not trade, a few days after their CEO said how non-technical teams are shipping code to production,” Orosz wrote on Friday.

Coinbase has faced scrutiny in the past due to outages during periods of high market volatility and infrastructure stress. In 2020, Coinbase experienced a brief outage as the price of bitcoin crashed 10% from $9,500 to $8,100 in 30 minutes. Other U.S. exchanges, including Kraken, had reported all systems as operational during the same period. A week prior to that, Coinbase experienced a similar outage when bitcoin rallied 15% to $8,900.

For Coinbase, which, as of now, appears to be the only crypto exchange affected by the May 7, 2026, outage, the disruption comes at a time when the company is facing financial and operational challenges.

On Thursday, Coinbase shares fell more than 5% in after-hours trading after it reported weaker-than-expected Q1 2026 results as decreasing crypto prices affected trading activity, one of the firm’s main revenue streams. The company posted a loss of $1.49 per share, compared with analyst expectations for a $0.27 profit. Revenue came in at $1.41 billion, below estimates of $1.52 billion.

It also follows its May 5 decision to slash its workforce by 14% or roughly 660 employees in response to negative market conditions and AI challenges. CEO Brian Armstrong announced the cuts in an X post on Tuesday, citing the “two forces” that converged in his firm’s decision to slash staff.

U.S. added 115K jobs in April, nearly doubling expectations

0

The U.S. labor market continued to show at least modest strength in April, according to data released Friday by the Bureau of Labor Statistics.

The economy added 115,000 jobs during the month, well above economist expectations for 62,000, though down from 185,000 in March (revised from an originally reported 178,000).

The unemployment rate remained at 4.3%, in line with forecasts.

Bitcoin traded at $80,200 in the minutes after the release, roughly flat over the past 24 hours. U.S. stock index futures added to earlier gains, the Nasdaq 100 higher by 0.9%. The 10-year Treasury yield fell 2 basis points to 4.37%.

The report arrives at a delicate moment for markets and policymakers. Last week, the Federal Reserve left its benchmark fed funds rate range unchanged at 3.50%-3.75%, extending its holding pattern as officials weigh slowing economic growth against persistent inflation pressures.

The data also comes ahead of a new chairman taking the reins at the Fed, with Kevin Warsh expected to soon be confirmed by the Senate to replace Jerome Powell later this month.

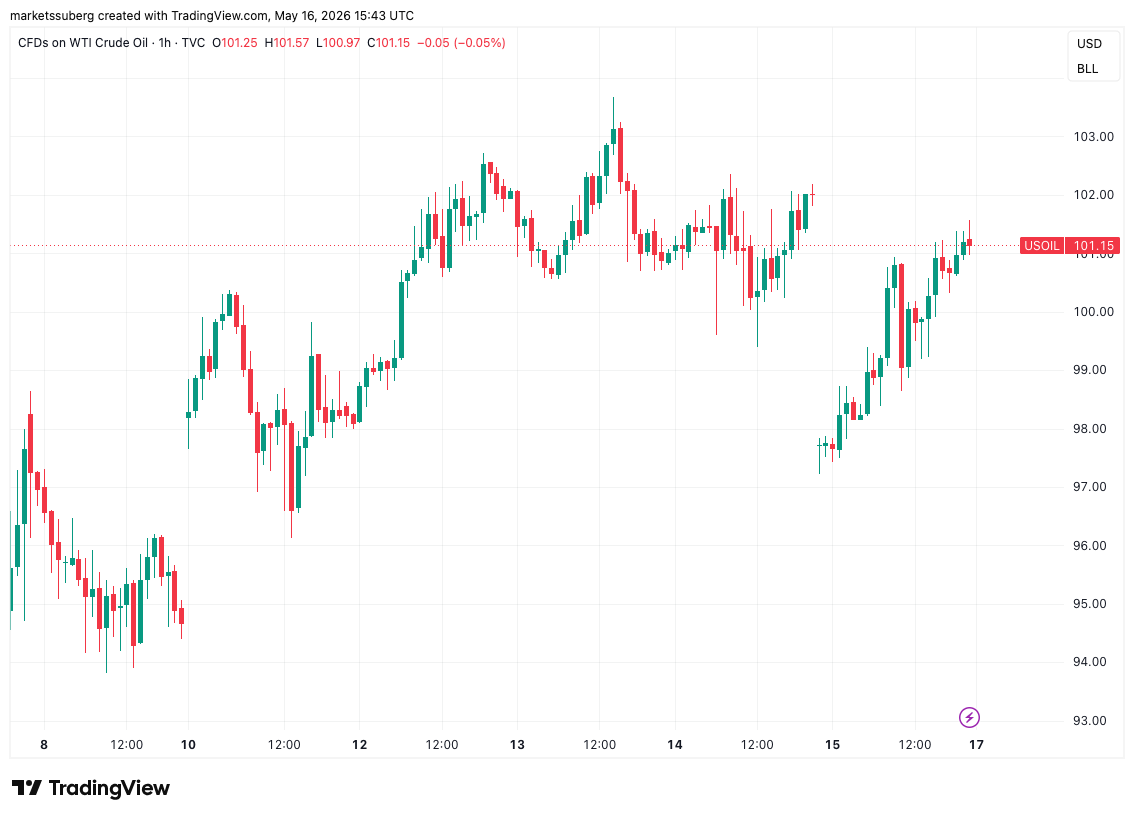
Though off their highs, oil prices have remained elevated, with uncertainty around the Strait of Hormuz keeping energy markets on edge. Higher crude prices risk feeding into headline inflation while also weighing on consumer spending and economic activity.

Beijing lab at $20B as AI investors look to China

0

Chinese AI vendor Moonshot has raised funding of about $2 billion at a valuation of $20 billion.

The investment was confirmed in a statement from Huafeng Capital, which advised some of the backers, and constitutes Moonshot’s fourth major fund raise this year, as use of its open source Kimi chatbot and open source large language models continues to spike.

The latest round was led by Dragonball, the investment arm of Chinese tech giant Meituan, with participation from Tsinghua Capital, China Mobile and CPE Yuanfeng. 

While not at the stratospheric level of funding that has become commonplace in the West over the past 12 months, the investment underscores growing investor interest in Chinese AI startups.

Moonshot has been building momentum since its founding, driven by the growing popularity of Kimi — which has seen subscriptions and API usage surge in recent months — and the Beijing-based lab is now the most heavily funded AI startup in China.

Related:Anthropic and SpaceX Agree to Major Compute Capacity Deal

It may not hold that status for long, however, with recent media reports that rival DeepSeek is on a major fundraising drive at a valuation of $50 billion.

Moonshot’s latest $2 billion capital injection was preceded by three separate rounds of $500 million, $700 million and another $700 in the months of 2026, with Chinese giants Tencent and Alibaba among those investing.

The vendor’s value, meanwhile, has grown more than fourfold since November last year, when it was rated at around $4.9 billion, while its annual recurring revenue topped $200 million in April, according to the Huafeng Capital statement.

The latest version of Kimi, K2.6, was released earlier this year, and is currently ranked second in a global ranking of AI models based on token usage by the OpenRouter distribution platform — ahead of Anthropic’s Claude, Google’s Gemini and xAI’s Grok.


Ethereum Bears Target $1,800 ETH Price: Here Is Why

0

Ether’s (ETH) price has retraced by over 5.6% to $2,275 after being rejected by resistance at $2,400. Now, multiple data points suggest ETH/USD may drop below $2,000.

Key takeaways:

  • Low network activity signals declining usage and reduced onchain demand for ETH.
  • Coinbase Premium remains negative as spot Ethereum ETF outflows returned, reflecting strong US-driven sell pressure.
  • Ether’s falling wedge pattern targets $1,830.

Ether’s total value locked hits 12-month lows

Ethereum’s network fundamentals are weakening, with weekly average transactions dropping by 10% to 4.79 million, per data from Nansen. Active addresses dropped by 8% to 2.5 million over the same period. 

Related: Three reasons why Ether price rallies fizzle near $2.4K

Network fees also dropped by approximately 27%, leading to a 47% reduction in onchain revenue over the last seven days. 

Blockchain comparison: Daily transactions, active addresses and network fees. Source: Nansen

Additional data from DefiLlama shows that the weekly DEX volumes dropped to $1.64 billion on May 8, a 46% drop over the last three weeks.

Low transaction count, a drop in active addresses and declining DEX volumes reflect reduced ecosystem usage. As a result, the total value locked (TVL) in Ethereum’s DeFi protocols has dropped to $124.7 billion, levels last seen in May 2025.

Total value locked on Ethereum. Source: DefiLlama

This subdued network activity signals weak user conviction, affecting Ether’s ability to sustain upside price momentum. 

Ether’s exit queue jumps 72,000%

Ethereum’s unstaking queue jumped by approximately 72,000% within two weeks to 530,985 ETH on May 2. 

As of Friday, over 202,000 ETH were queued for redemption, with a wait time of around three days.

Number of Ether queued for exit. Source: Validator Queue

The surge comes after a series of significant DeFi hacks, reflecting investor caution. April 2026 saw DeFi platforms suffer a record $625 million in monthly losses following 30 separate attacks, including a $292 million loss from the KelpDAO bridge hack, leading to over $15 billion in deposits withdrawn from the Aave platform

These incidents have prompted investors to unstake ETH to regain liquidity, signaling flight from perceived risk.

“The exit queue went from ~700 ETH to ~500K ETH in 2 weeks,” analyst Pete said in a recent post on X, adding:

“DeFi yield on Ethereum is getting crushed by hacks, exploits and increasingly nasty attack surfaces.”

Despite the sharp surge in outflow pressure, 3.6 million ETH remains queued for staking entry (7x exit volume), pushing total staked ETH to 38.6 million (31.72% of supply) despite 45-day wait times.

Ether’s Coinbase Premium remains negative

The Ethereum Coinbase Premium Index, which tracks the price difference between ETH on Coinbase and Binance, has stayed negative since April 27.

A negative premium confirms that the selling pressure is originating heavily from US entities. As long as US investors are selling at a discount compared to the global market, downside momentum will likely accelerate.

Ethereum Coinbase Premium Index. Source: CryptoQuant

Additionally, US-based spot Ethereum ETFs snapped a four-day inflow streak with $103 million in net outflows on Thursday, the largest withdrawal since mid-March.

Spot Ethereum ETFs flows chart. Source: SoSoValue

Coupled with more than $81.6 million in outflows from global Ethereum investment products last week, this points to institutional selling, adding to Ether’s headwinds.

Meanwhile, ETH taker buy volume dropped to as low as -$25 million on Binance in recent days, indicating a “sharp increase in aggressive market sell orders,” CryptoQuant analyst BorisD said in a Quicktake note on Friday, adding:

“This structure raises the risk of short-term volatility and a support retest for ETH price action.”

ETH taker buy volume on Binance. Source: CryptoQuant

Ether’s rising wedge breakdown is underway

The daily chart shows the ETH/USD pair validating a rising wedge pattern after the price lost support at the pattern’s lower trend line at $2,300. 

Bulls are now fighting to keep the price above $2,150-$2,200, where the 100-day and 50-week simple moving averages (SMAs) are, respectively.

Another key line of defense is the $2,000 psychological level, which, if breached, would clear the path for Ether’s drop toward the measured target of the wedge at $1,830, about 20% below the current price.

ETH/USD daily price chart. Source: Cointelegraph/TradingView

As Cointelegraph reported, the ETH price may descend to $1,750-$1,850 if support at $2,300 is not reclaimed in the short term.

This article is produced in accordance with Cointelegraph’s Editorial Policy and is intended for informational purposes only. It does not constitute investment advice or recommendations. All investments and trades carry risk; readers are encouraged to conduct independent research.

Bitcoin Traders Have These Support Levels in Mind as $80,000 Battle Returns

0

Bitcoin (BTC) revisited $80,000 on Friday after US-Iran war nerves sparked 3% daily losses.

Key points:

  • Bitcoin bullish momentum slowly returns after a shakeout amid familiar geopolitical tensions.
  • Traders flag support levels in the mid- to high-$70,000 zone as important for bulls to defend.
  • Unprecedented Bollinger Bands data calls for more volatile conditions going forward.

Bitcoin retests $80,000 after sell-off

Data from TradingView showed BTC price downside pressure easing toward the Wall Street open.

BTC/USD one-hour chart. Source: Cointelegraph/TradingView

Thursday had seen risk assets lose out amid rumors of the US restarting its “Project Freedom” campaign against Iran, while military strikes from both sides placed a fragile ceasefire in jeopardy. The S&P 500 came off new all-time highs.

S&P 500 one-hour chart. Source: Cointelegraph/TradingView

Commenting, crypto trader Michaël van de Poppe said that the retracement was no “surprise” given recent brisk gains.

“Assets trend in waves. Bitcoin has seen multiple days of momentum upwards, so it’s not strange to expect it to consolidate just now,” he wrote in an X post at the time. 

“As long as the trend remains intact, I think we’ll see more upside during coming weeks.”

BTC/USDT one-day chart. Source: Michaël van de Poppe/X

Van de Poppe subsequently described Bitcoin as “doing just fine,” but said $76,000 needed to hold as support.

“The first rally out of a bear market lands at that resistance, and it would give some more momentum for Altcoins,” he added.

Trader Jelle also remained optimistic on the outlook while arguing that the day’s lows near $79,000 needed to hold.

“Even in the bearish case, I believe the turquoise zone will hold the price and trigger a reversal to the upside,” he told X followers about charts showing $74,500 as a potential downside target.

BTC/USDT charts. Source: Jelle/X

Bitcoin volatility metric demands larger moves

On daily time frames, BTC/USD thus failed to sustain a break beyond the upper band of the Bollinger Bands volatility metric.

Related: Bitcoin can crash to $50K if ‘most critical’ bear market test fails: Analysis

BTC/USD one-day chart with Bollinger Bands data. Source: Cointelegraph/TradingView

As Cointelegraph reported, positive signals from the Bands even inspired their creator, John Bollinger, to take a position via his proprietary investment funds.

In an X response, trader SuperBro observed the narrowest-ever conditions for the Bands on monthly time frames — a key prerequisite for heightened volatility next.

BTC/USD one-month chart with Bollinger Bands data. Source: Cointelegraph/TradingView

This article is produced in accordance with Cointelegraph’s Editorial Policy and is intended for informational purposes only. It does not constitute investment advice or recommendations. All investments and trades carry risk; readers are encouraged to conduct independent research.

Hiring slowdown could be great for bitcoin (BTC) — unless wages spoil the party

0

Friday’s U.S. nonfarm payrolls report could inject volatility into the crypto market. Economists expect April job growth to slow sharply, with payrolls forecast to rise by just 62,000 compared with March’s 172,000, while the unemployment rate is seen holding steady around 4.3%, according to Reuters.

At first glance, weaker hiring data appears supportive for bitcoin and other risk assets. A softer labor market could reinforce expectations that the Federal Reserve will keep rates steady this year and potentially delay any tightening cycle beyond that. As of now, markets are pricing in steady rates through this year, followed by a hike next year.

But the picture is more complicated.

Alongside the payrolls release, markets will also be watching wage growth closely. Average hourly earnings are expected to rise 3.8% year-on-year, up from 3.5% previously. Sticky wage pressures, combined with already elevated oil prices, could strengthen inflation concerns globally and complicate the Fed’s path forward.

In other words, the market reaction may hinge less on headline job creation and more on whether wage growth cools. With traders already pricing in the possibility of future rate hikes next year, risk assets may need a softer-than-expected earnings figure to stage a meaningful rally.

For now, analysts remain broadly constructive on bitcoin, with the $75,000 level seen as critical support.

“Bitcoin has returned below $80K, extending its retreat from the 200-day moving average after briefly entering overbought territory near the upper boundary of its uptrend channel. The lower boundary of that channel sits near $77.5K, though a broader trend break would likely require a fall below recent lows around $75K,” said Alex Kuptsikevich, chief market analyst at FxPro.

Beyond payrolls, traders are also keeping an eye on the upcoming minutes of the Fed’s April meeting, as well as developments in the Strait of Hormuz and global oil markets.

“Prediction markets assign a 97% probability to no Hormuz normalization by May 15. The gap between that pricing and the equity market’s willingness to fade every escalation is the week’s defining contradiction,” Singapore-based QCP Capital said in a market note. “If crude fails to de-escalate before the May 20 FOMC minutes, the stagflation narrative will become much harder to dismiss.”

Stay alert!

Read more: For analysis of today’s activity in altcoins and derivatives, see Crypto Markets Today . For a comprehensive list of events this week, see CoinDesk’s “Crypto Week Ahead.”

What’s trending

S&P 500 call options volume surges to record $2.6 trillion. Here’s what it means for bitcoin (CoinDesk): Record volumes of bullish S&P 500 call options signal a surge in speculative risk-taking on Wall Street, offering bullish cues to crypto, as the two are positively correlated.

Trump says ceasefire still holds after fighting between the U.S. and Iran flares (Reuters): U.S. and Iran clashed in ​the Gulf and the UAE came under renewed attack, but Trump said a ceasefire was still holding despite the attacks, which dented hopes for a ‌swift end to the war.

U.S. stocks rise as tech outlook offsets war worries: market wrap. (Bloomberg): A rally in technology stocks is lifting U.S. index futures as investors wait for the monthly jobs report. Oil fluctuated. Benchmarks in Europe and Asia fell. Brent moved to just above $100 a barrel. The dollar headed for a second straight week of losses.

Federal court rules against new global tariffs Trump imposed after loss at the Supreme Court (AP): A federal court ruled against the new global tariffs that Trump imposed after a stinging loss at the Supreme Court. The Court of International Trade in New York ruling found the 10% global tariffs were illegal after small businesses sued.

Today’s signal

The chart by coinglass tracks the Coinbase Bitcoin Premium Index, which measures the price difference between bitcoin traded on Coinbase, a proxy for U.S. institutional and spot demand, and offshore exchanges such as Binance. Green readings indicate BTC is trading at a premium on Coinbase, signaling stronger demand from U.S.-based investors.

The premium has flipped into a discount this week just as bitcoin looked to establish a foothold above $80,000. Interestingly, the rally has stalled.

Historically, bull runs have coincided with persistent positive readings in the index. The next move higher, therefore, warrants a return of the premium.