Home Blog Page 215

Gold slips below 200-day moving average offering glimmer of hope for bitcoin bulls

0

Gold has fallen below its 200-day moving average (200DMA), a widely followed long term technical indicator that tracks the average closing price over the previous 200 trading days.

A break below the 200DMA is often interpreted as a sign that long term bullish momentum has weakened and that a broader trend reversal may be underway. This is the first time gold has traded below its 200DMA since October 2023, with prices now slipping beneath $4,300 per ounce.

The decline follows a huge rally in which gold surged nearly 200%, climbing from below $2,000 per ounce in October 2023 to a record high of $5,600 in January this year. Much of that advance was driven by the “debasement trade”, the investment thesis that government spending, rising debt levels, and loose monetary policy would erode the purchasing power of fiat currencies, increasing demand for scarce stores of value such as gold.

Gold has now entered bear market territory, having fallen more than 20% from its all time high. The latest weakness follows a stronger than expected U.S. jobs report on Friday, which prompted markets to price in a greater likelihood of Federal Reserve tightening. CME FedWatch Tool, now assigns a 25 basis point rate hike in December, which would lift the federal funds rate to a range of 3.75% to 4.00%.

Silver, which is often viewed as a higher beta version of gold due to its greater volatility, is currently testing support at its own 200DMA near $67 per ounce.

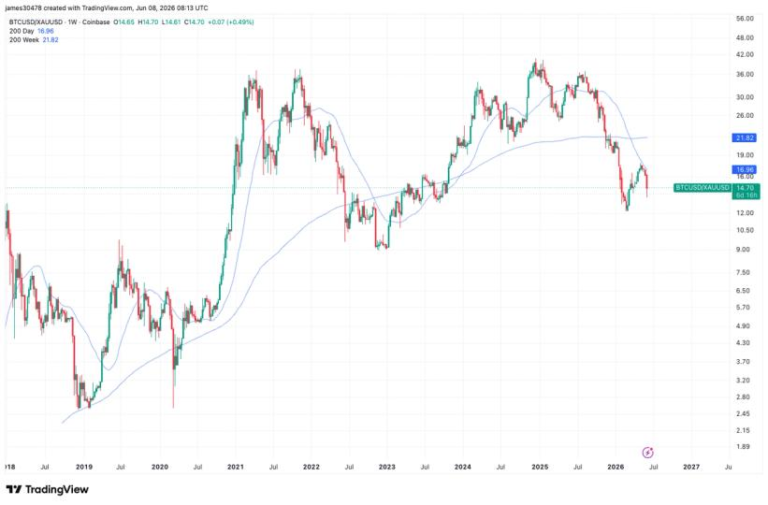
The bitcoin to gold ratio, which measures how many ounces of gold one bitcoin can purchase, has risen 3% over the past 24 hours to 14.72 ounces as bitcoin recovers toward $63,000.

Despite the rebound, the ratio remains roughly 70% below its December 2024 peak of approximately 41 ounces. Last month, the ratio was rejected at its 200DMA, which preceded bitcoin’s decline below $60,000. However, the ratio remains above its February lows, offering a modest sign of resilience for bitcoin bulls.

Adding further pressure to risk assets, the US Dollar Index (DXY) has climbed back above 100. A stronger dollar is typically a headwind for commodities, gold, and cryptocurrencies because it tightens global financial conditions, reduces liquidity, and makes dollar denominated assets more expensive for international investors.


Galaxy Digital Drops Odds of CLARITY Act Passing to 60%

Crypto firm Galaxy Digital has lowered the odds of the Senate passing its crypto market structure bill before the end of the year, noting that the window for lawmakers to act on the bill is closing. 

“On May 22, we raised our estimate of the probability that the CLARITY Act becomes law in 2026 to 75%, up from the 55% we published the morning of May 14’s Senate Banking markup, Galaxy’s head of research Alex Thorn said in a note on Friday. “We are now lowering that estimate to 60%.”

Thorn said the bill must pass the Senate before a month-long August recess starting in late July, as “after that, the window effectively closes.” He added that major legislation has historically not moved in the lead-up to the midterm elections due to lawmakers campaigning.

Many Senate lawmakers have been pushing for the chamber to pass the bill after the House passed its version, called the CLARITY Act, last year.

The Senate Agriculture and Banking Committees have passed versions of the bill, and it now needs at least 60 votes on the Senate floor to pass without prolonged debate.

“For a 60-vote bill that still needs floor debate, an amendment process, reconciliation with the Senate Agriculture text, and then House action on the changes, Majority Leader [John] Thune realistically needs to schedule floor time at some point in July,” Thorn said.

“Anything later and the procedural steps do not fit before the recess,” he added.

Source: Alex Thorn

Thorn said another reason Galaxy lowered its odds is that no information shows that the bill, or negotiations around it, have advanced, and provisions around ethics and illicit finance are a sticking point that have not yet been resolved.

He added that Galaxy would revise its odds if Senate leaders committed to passing the bill next month and that provisions to get lawmakers on side are finalized.

Galaxy’s latest odds came after analysts at JPMorgan on Wednesday said they see less than a 50% chance that the CLARITY Act passes this year, similarly citing a tightening congressional calendar ahead of the elections.

Meanwhile, Bitwise investment chief Matt Hougan said on Tuesday that his view of the bill passing this year is “less optimistic,” and that “D.C. insiders” he spoke with put the odds of its passage between 5% and 30%.

Senator Cynthia Lummis, the chair of the Senate Banking Subcommittee on Digital Assets, has escalated her calls for the Senate to pass the bill, having made at least 15 posts on X about the legislation so far in June.

“The Clarity Act passed committee. The floor is next. We did not come this far to quit at the 5 yard line,” she posted on Sunday.

Lummis told CNBC on Wednesday that lawmakers working on the bill are addressing issues, including around ethics and illicit finance, that could see it lose support on a floor vote.

Magazine: Will the CLARITY Act be good — or bad — for DeFi?

Bitcoin spikes, then dumps, from $63,700 as analysts assess Strategy’s next BTC moves

0

Two of the largest crypto treasury companies are diverging in their market strategies.

Strategy (MSTR) disclosed on June 1 that it sold 32 bitcoin at an average of $77,135, its first sale in four years, with the proceeds going to fund the dividend on its STRC perpetual preferred stock.

Days later, Tom Lee’s BitMine (BMNR) priced an upsized 9.50% Series A perpetual preferred offering, 3.5 million shares at $80, raising about $274 million it plans to spend buying more ether.

The shares settle June 10, and the company has applied to list them on the NYSE as BMNP.

Laser Digital shared in a Monday note with CoinDesk that one firm was selling its reserve asset to service a yield obligation. The other is taking on a fresh 9.50% obligation to buy more of an asset that keeps falling.

The firm’s options desk reads the positioning as defensive. Term structure has inverted hard, and a trader bought end-June $50,000 bitcoin puts, funding part of it by selling $75,000 calls, the company said.

Watch Wednesday’s US CPI print. A hot number widens the right tail on rates and hands the put buyers their thesis.

Bitcoin’s rebound triggers the most short liquidations since late April

0

Bitcoin’s recovery from last week’s lows has crushed the traders who bet against it.

Short sellers, who profit when prices fall, lost $504 million over the 24 hours to Monday morning, the most in a single day since late April, according to CoinGlass. Bets on rising prices lost just $151 million by comparison.

Total liquidations across crypto reached about $655 million and hit more than 104,000 traders. Bitcoin positions accounted for $315 million and ether for $201 million. The single biggest forced closure was a $12.3 million bitcoin futures position on the exchange OKX.

A liquidation is when an exchange automatically closes a leveraged bet that has moved too far against the trader.

The squeeze caps a volatile stretch for the world’s largest cryptocurrency. Bitcoin fell nearly 14% last week and briefly traded below $60,000, dragged down by Strategy’s first bitcoin sale since 2022, the unwind in artificial-intelligence stocks and a record run of outflows from spot bitcoin exchange-traded funds.

Many traders piled into shorts near the lows, then got caught when bitcoin rebounded to a high near $63,800 on Sunday, according to CoinDesk data.

The bounce lost some steam on Monday. Renewed strikes between Iran and Israel sent oil up more than 3% and Asian stocks sharply lower, with South Korea’s KOSPI falling almost 7%. President Donald Trump urged Israel not to retaliate further. Bitcoin slipped back to around $62,900, still well above last week’s floor.

Bitcoin reached as high as $63,700 on Monday morning before retreating, according to CoinDesk data, with volatility likely to stay high ahead of U.S. inflation figures and a wave of major IPOs including SpaceX.

RIpple-linked token steadies above $1.10 from four-month lows

0

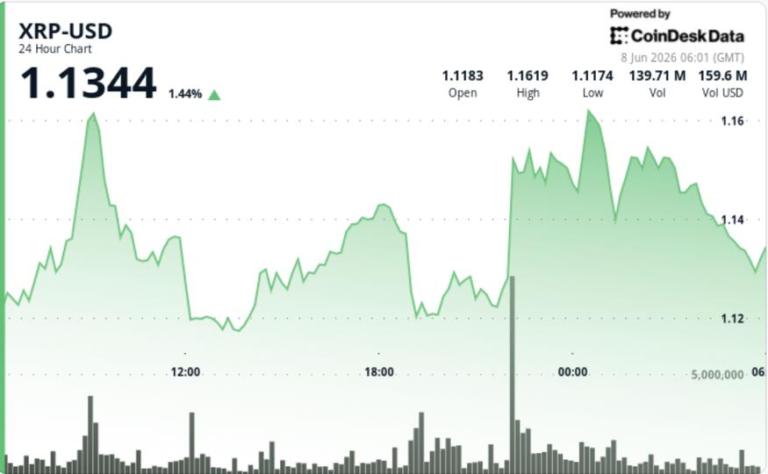
XRP finally found buyers after one of its sharpest selloffs of the year, but the recovery looks more like stabilization than a trend change. The token bounced from levels last seen before the November 2024 breakout, yet every rally is still running into sellers, leaving XRP stuck between deeply oversold conditions and a market that hasn’t stopped de-risking.

News Background

• More than 25 million XRP left exchanges in recent days, extending a trend that typically points to accumulation rather than immediate selling.

• XRP-linked ETF products continued attracting capital, with roughly $118 million in inflows recorded during May and cumulative inflows approaching $1.4 billion.

• Analysts and forecasting models increasingly view the $1.10-$1.20 area as a potential stabilization zone after XRP’s recent 17% weekly decline.

Price Action Summary

• XRP gained 1.6% over the session, recovering from lows near $1.09 and climbing back toward $1.14.

• The strongest move came during the 22:00 UTC session, when volume surged to 145.3 million XRP and pushed price through resistance near $1.1350.

• Momentum faded into the close, with XRP slipping from $1.1488 to $1.1386 before buyers stepped back in near support.

Technical Analysis

• The bigger story is that XRP remains trapped inside a descending channel despite the bounce. The recovery eased immediate downside pressure but did not break the broader pattern of lower highs.

• The RSI has fallen to one of its most oversold readings since before the November 2024 rally, a sign that selling may be becoming exhausted.

• Exchange outflows and ETF inflows continue to point toward accumulation beneath the surface, but price action still resembles a market trying to find a floor rather than one beginning a new uptrend.

• The bounce from $1.09 matters because it showed buyers are willing to defend the area, though follow-through buying remains limited.

What traders should watch

• $1.13-$1.14 is now the key near-term support zone after the latest recovery.

• $1.15 remains the first meaningful resistance level and the upper boundary of the current descending channel.

• A move above $1.20 would be the first sign that XRP is starting to repair the damage from the recent selloff.

• If support near $1.10 fails again, traders are likely to focus on whether the psychologically important $1.00 level becomes the next downside target.

What Happens to Bitcoin If Nasdaq Falls Further?

0

Bitcoin (BTC) traders said that BTC holding above the $60,000 psychological support over the weekend was important as it recovered 6.5% from a local low near $59,100 to an intraday high of around $62,950 on Sunday.

Key takeaways:

  • BTC is eyeing a rally toward $92,630 if it continues to hold above a key moving-average support.
  • Nasdaq technicals hint at a potential decline of over 10% in the short term.

BTC may rise above $90,000 if Nasdaq underperforms

Bitcoin’s rebound stood out as the tech-heavy Nasdaq Composite (IXIC) plunged more than 4% on Friday, its steepest one-day drop since April 2025. This has raised hopes that risk capital may return to BTC markets.

BTC/USD vs. IXIC daily performance chart. Source: TradingView

Technical commentary shared by veteran analyst Filbfilb offered some hope for the Bitcoin bulls.

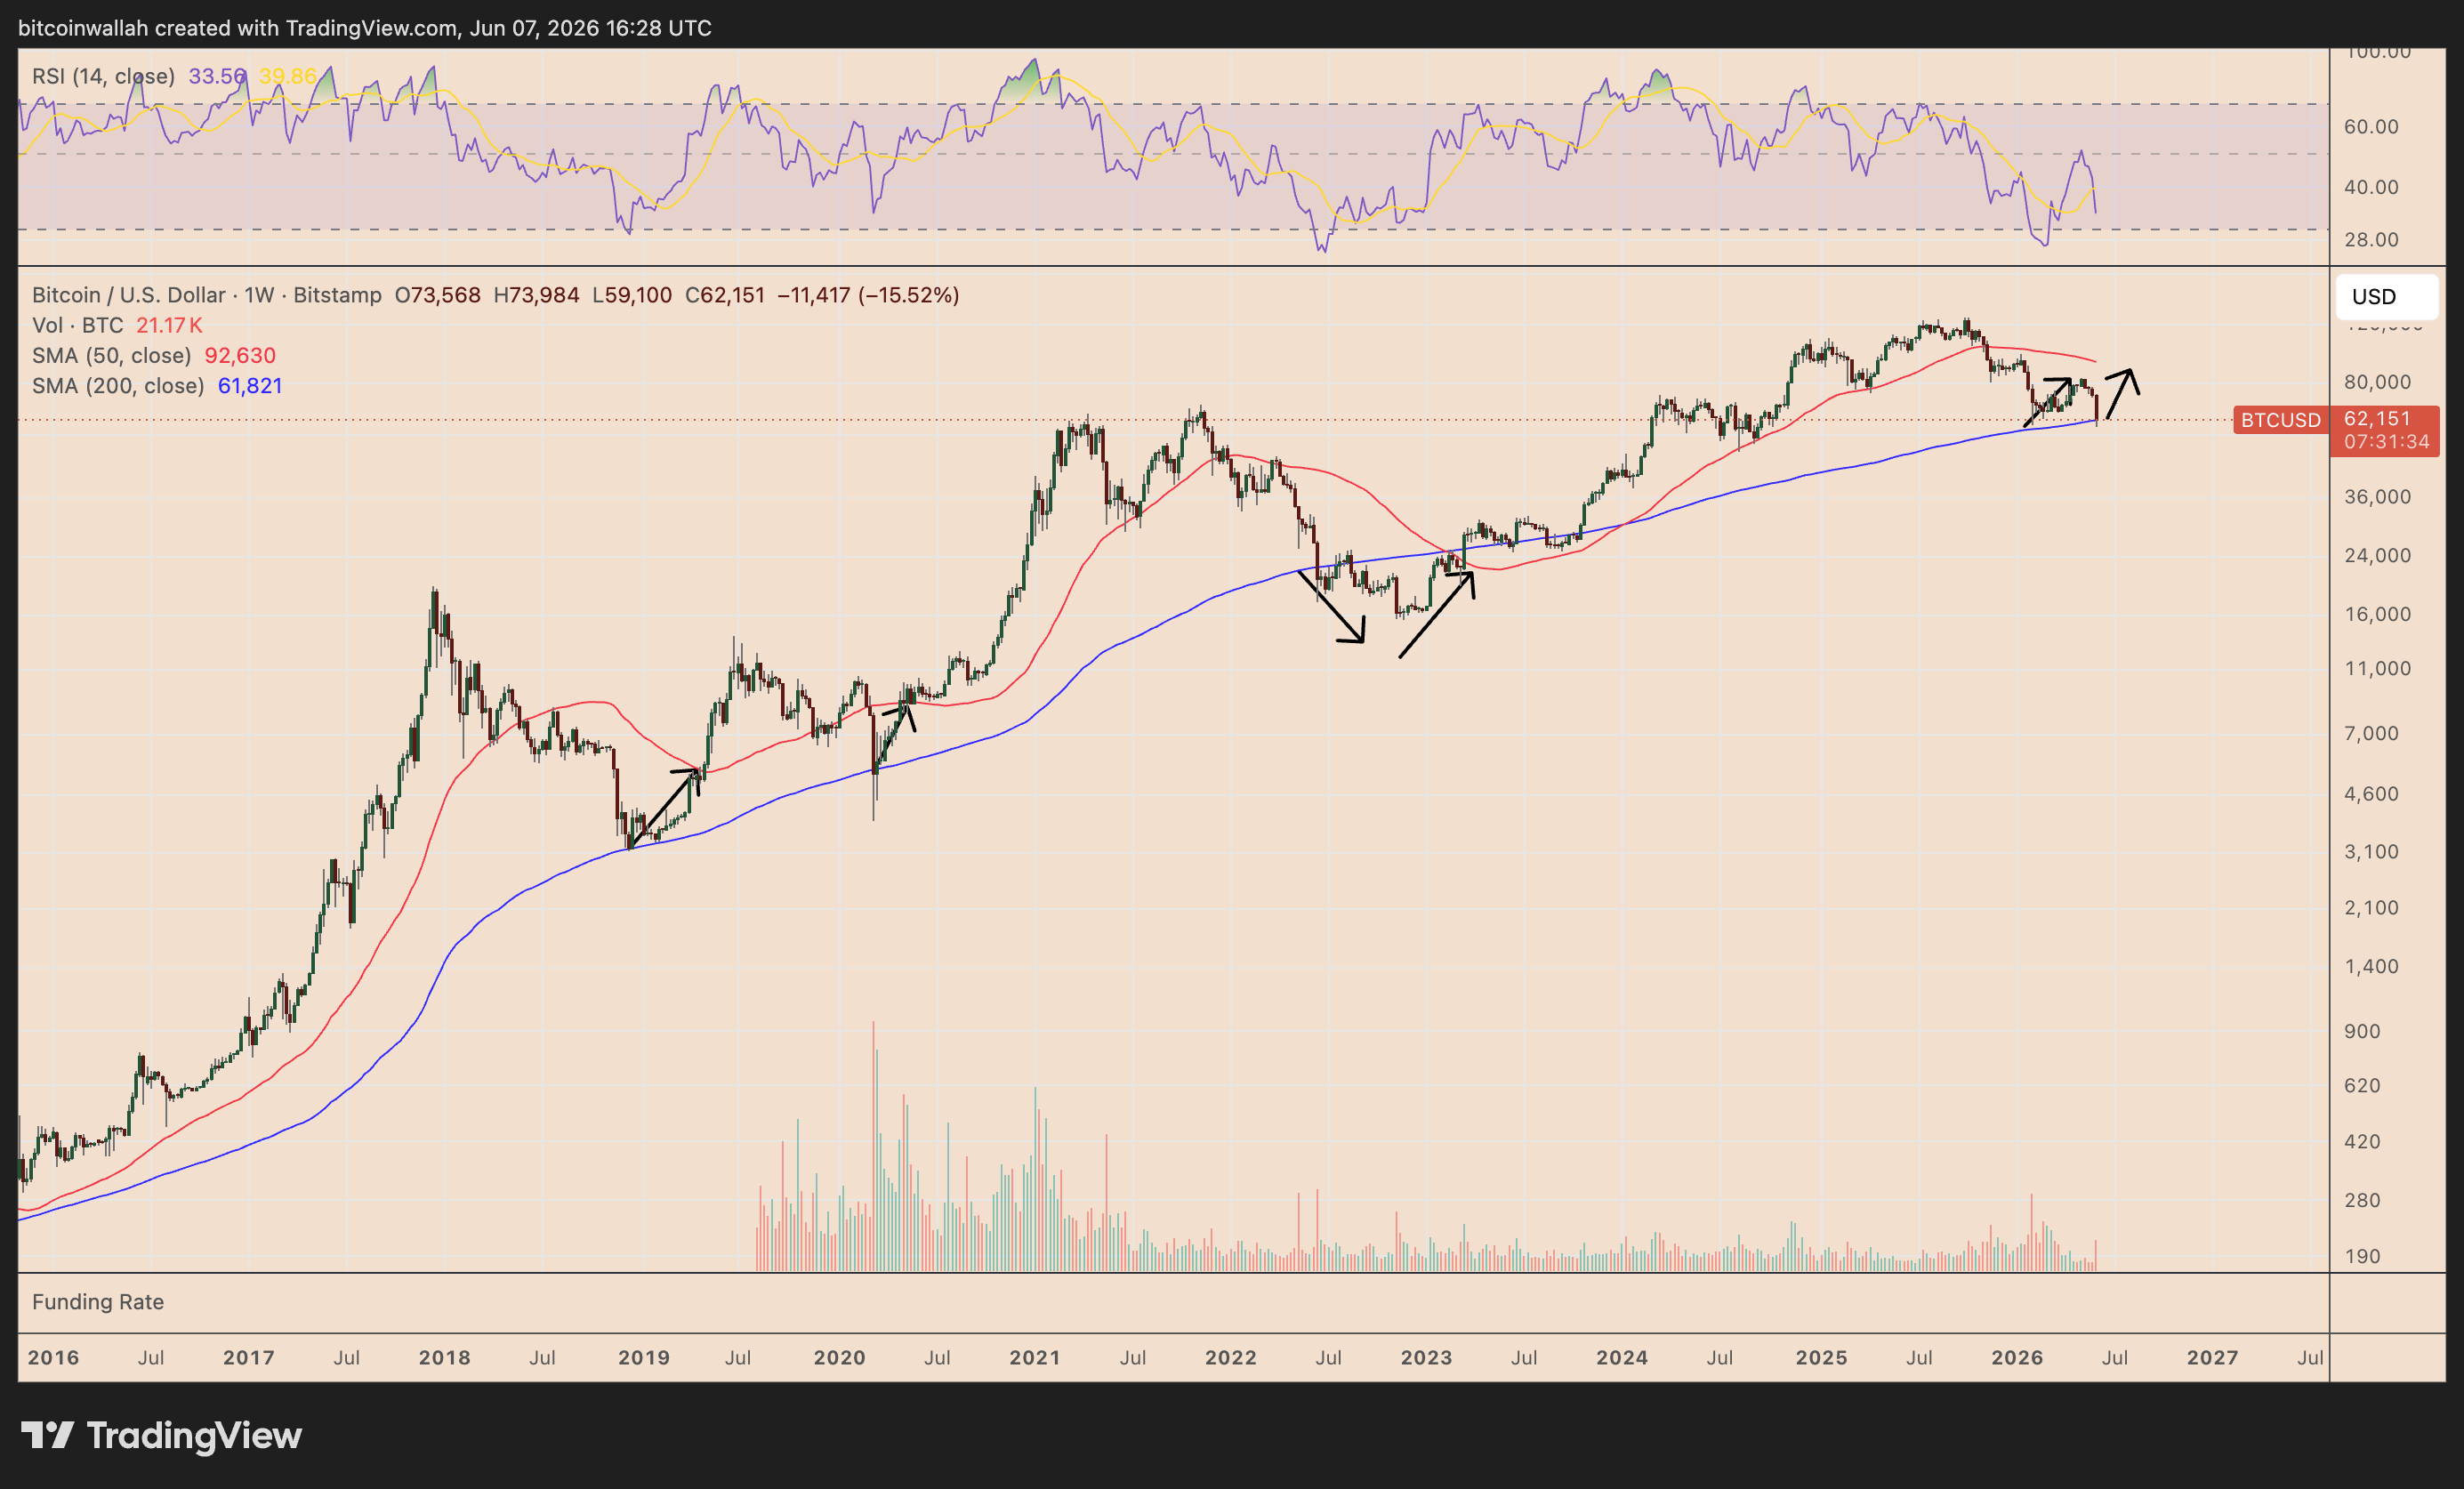
In a Sunday post, the analyst highlighted Bitcoin holding strong above its 200-week simple moving average (200-week SMA, the blue line) at around $61,880. This level has helped form the bottom in 2020, 2018, and 2015.

BTC/USD weekly chart. Source: TradingView

In other words, traders may view the dip below $60,000 as a shakeout if BTC holds the 200-week SMA, with the 50-week SMA (red) near $92,630 becoming the next major upside target.

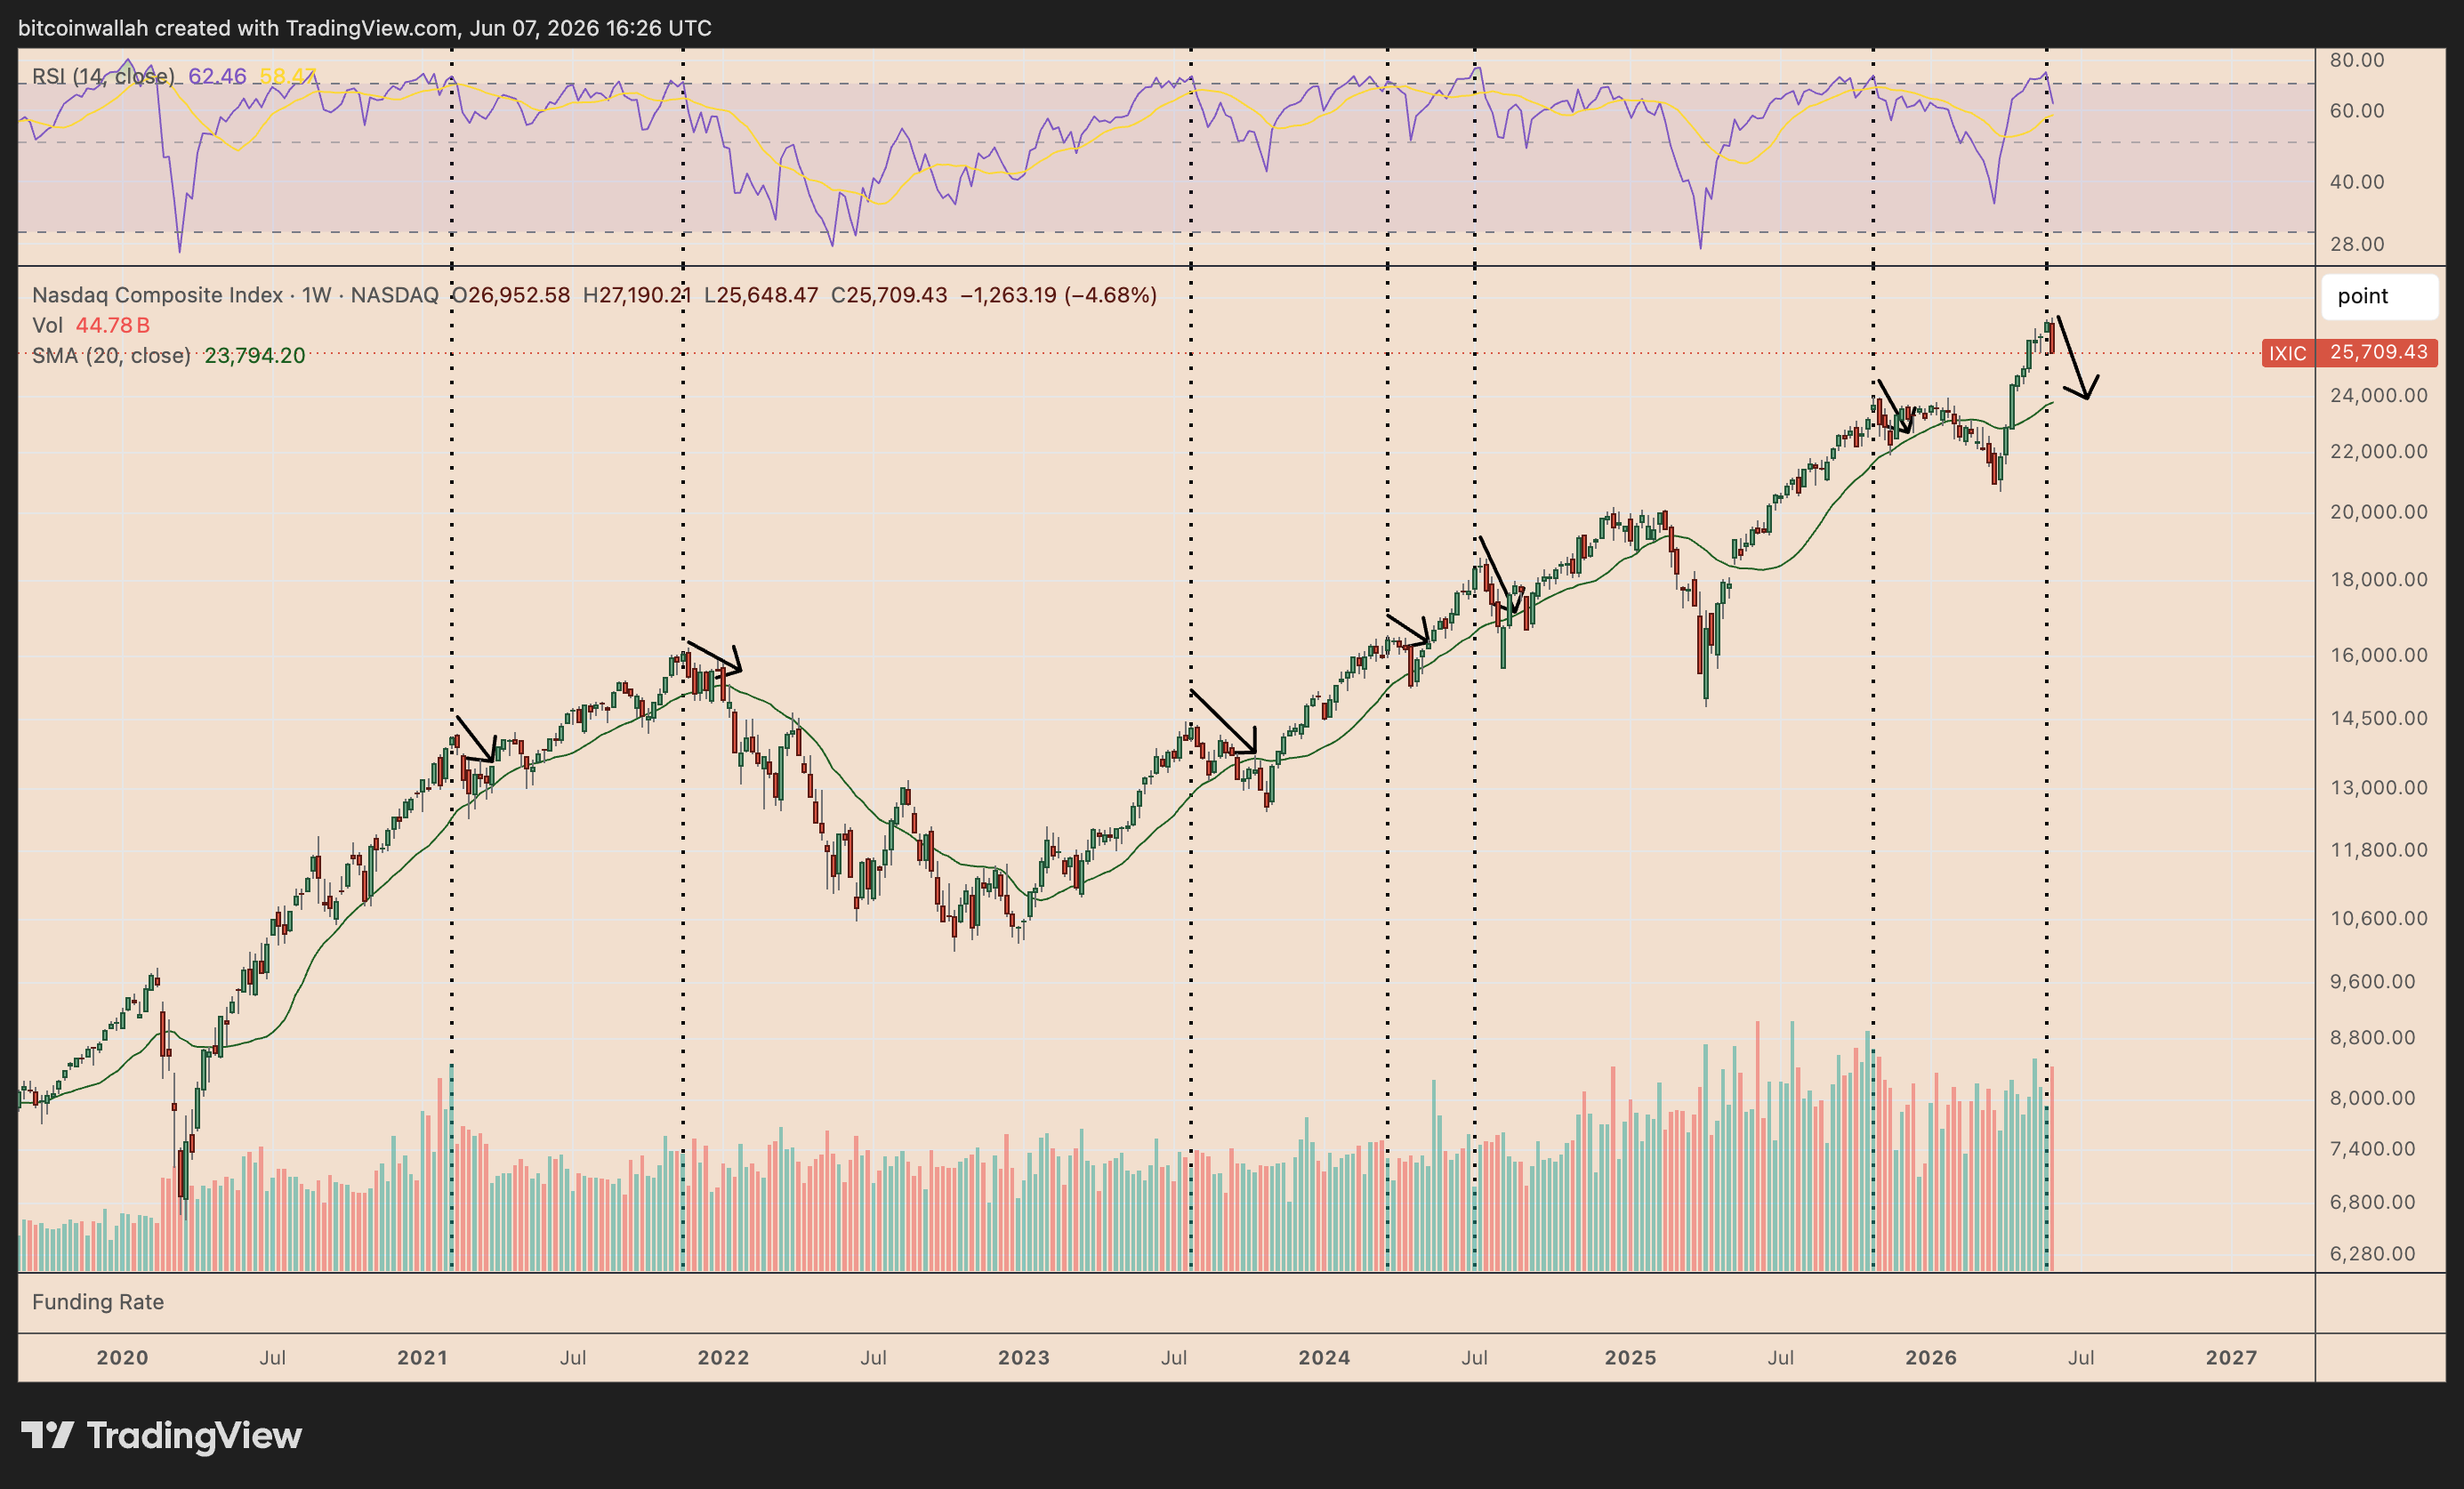
At the same time, the Nasdaq appears to be correcting toward its 20-week SMA, the green line near 22,905 points, after its weekly relative strength index (RSI) fell to 62.46 from around 74.75.

Every major Nasdaq weekly RSI drop from above 70 (overbought) to below 70 since 2021 has led the index back toward its 20-week moving average.

IXIC weekly chart. Source: TradingView

The Nasdaq could fall toward 22,905 if the fractal repeats, implying a further decline of about 10.75% from current levels in June or by July.

That said, Bitcoin could be setting up for a sharp mean-reversion rebound if it holds its long-term floor while the Nasdaq continues to cool off.

Bitcoin-Nasdaq ratio supports BTC rebound scenario

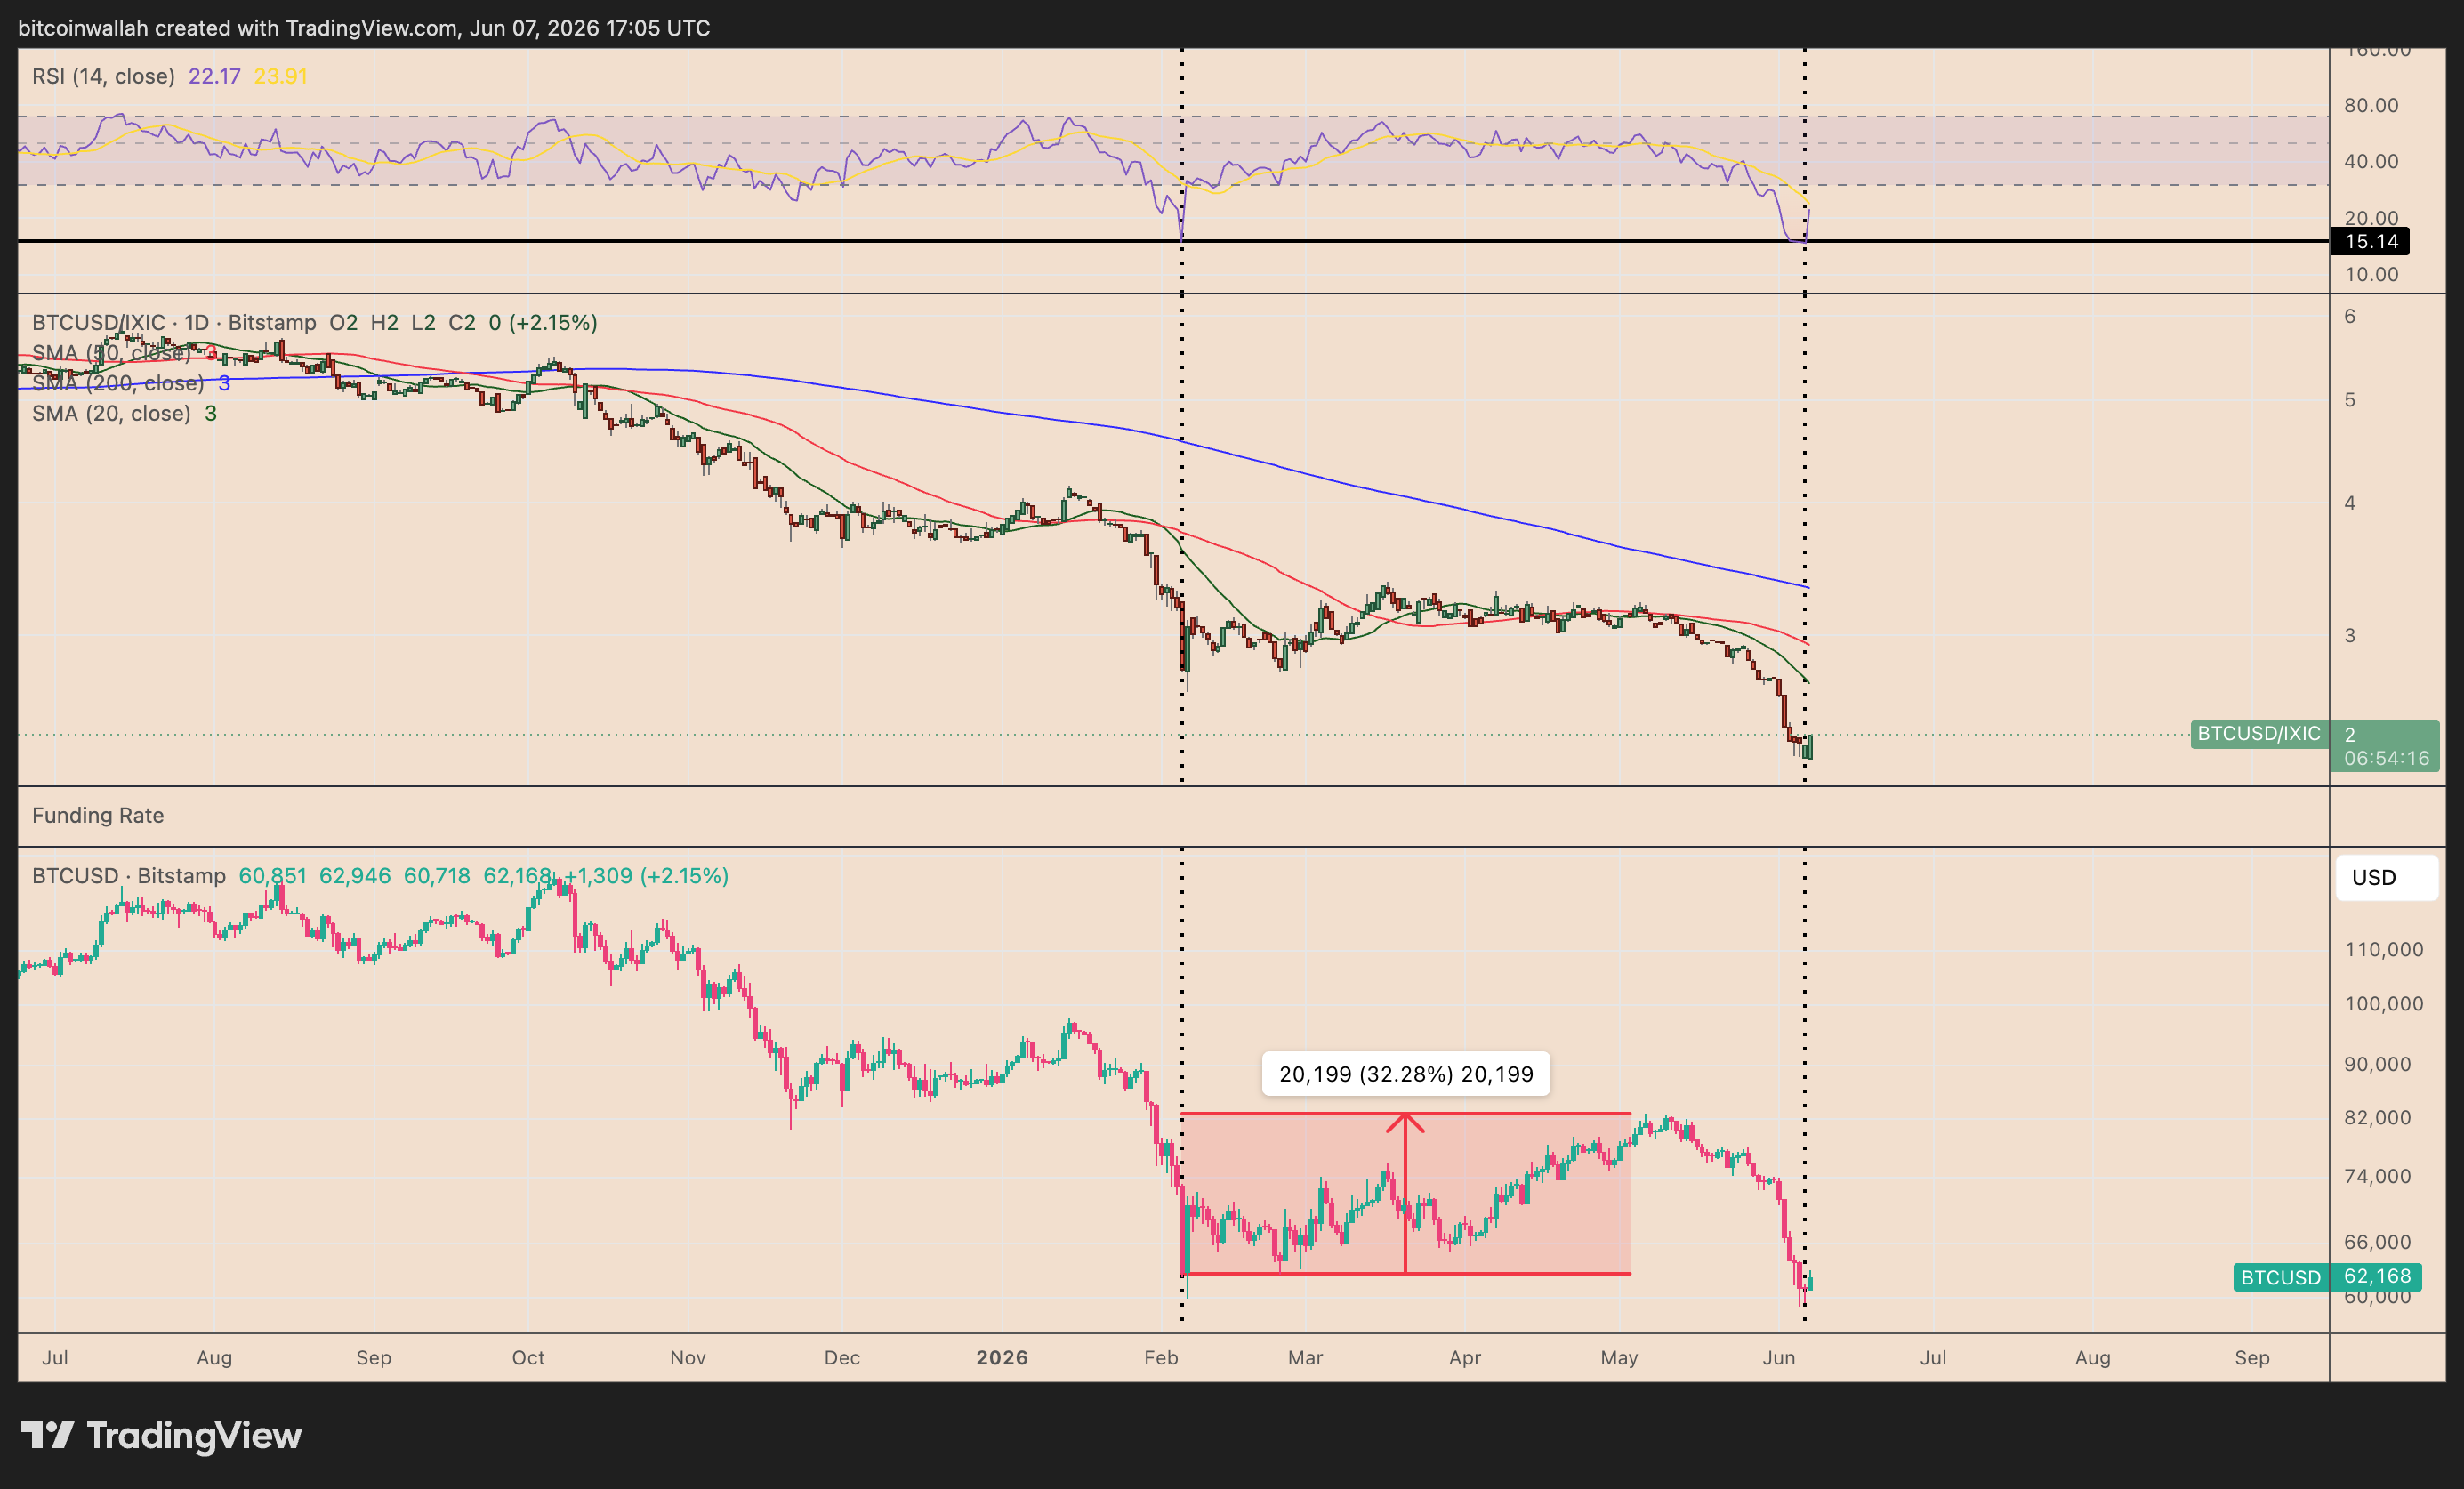
Bitcoin’s ratio against the Nasdaq has again reached a record oversold zone, according to its daily RSI readings.

Related: Bitcoin most oversold since 2020 crash: Can BTC rebound to $70K next?

On Saturday, the RSI dropped to 14.70, the lowest in history. The previous record was 14.88, set in February, ahead of a 30%-plus recovery in BTC prices.

BTC/IXIC vs. BTC/USD daily chart. Source: TradingView

In simple terms, Bitcoin had become too cheap relative to the Nasdaq, and buyers stepped in. The same setup is appearing again, reiterating a potential rebound in BTC prices in the coming weeks.

AI, tech IPOs, quantum, Strategy sale fears all converge, NYDIG says

0

Bitcoin dropping below $60,000 to a fresh cycle low has left investors searching for a culprit. According to Greg Cipolaro, global head of research at NYDIG, there probably isn’t only one.

In a report last week, he argued that bitcoin and the broader crypto market is facing several overlapping headwinds that have been weighing on prices.

The AI trade sits near the top of his list as bitcoin is increasingly competing for capital with a sector that has become the market’s dominant growth story.

The overlap between AI and crypto investors is larger than many assume, he argued. Both attract investors seeking exposure to emerging technologies and outsized returns. As AI-related stocks continue to outperform, capital followed and rotated from crypto, he wrote.

Investors are also preparing for what could be the largest tech IPO cycle in years. Companies such as SpaceX, OpenAI, Anthropic are widely expected to eventually go public, with SpaceX already deep into the process of making its debut. Large IPOs often prompt institutions to raise cash and reduce existing positions ahead of new offerings, creating a potential headwind for crypto demand, he wrote.

Crypto has also been grappling with a series of industry-specific concerns.

Treasury Secretary Scott Bessent’s claim that U.S. authorities seized roughly $1 billion of Iranian-linked crypto assets raised questions about government reach into digital asset markets. Details remain limited, but the episode challenged one of crypto’s core narratives for some investors, Cipolaro said.

Threat of quantum computing also returned to the conversation after researchers published new work showing that the computational resources required to attack widely used cryptographic systems may be falling faster than previously thought.

Then there is Strategy (MSTR) selling bitcoin.

The sale of 32 BTC, worth $2.5 million at the time, was insignificant from a supply perspective but carried more weight psychologically. Strategy has spent years acting as one of the market’s most consistent buyers, Cipolaro said. Any suggestion that it could become a source of supply, he argued, forces investors to rethink an important pillar of the bull case.

Taken together, those developments could explain why bitcoin has struggled despite no obvious deterioration in underlying network activity or adoption trends.

“Viewed independently, none of these developments appears sufficient to drive a major correction in bitcoin,” Cipolaro wrote. “Viewed collectively, they help explain why price action has weakened despite the absence of a clear deterioration in underlying adoption metrics.”

Has bitcoin found a bottom?

Cipolaro’s onchain analysis offers a mixed answer.

Several indicators are approaching levels that have historically coincided with major bottoms, he noted. Bitcoin’s MVRV ratio has fallen to 1.2, close to the level where market value converges with investors’ aggregate cost basis. The percentage of supply held in profit recently slipped below 50%, another metric often associated with capitulation.

Yet the drawdown itself remains relatively modest by historical standards.

Bitcoin fell down roughly 53% from its peak ($126,000 in October), a much shallower decline than the 75%-90% drawdowns seen in prior cycles, he pointed out.

There’s also a time element: the previous three bitcoin bear markets lasted more or less a year from peak to trough, with the exception of its first-ever bear market ending in 163 days in 2011.

Friday’s sub-$60,000 plunge came only 242 days after the peak.

That means either institutional adoption has fundamentally changed bitcoin’s cycle behavior — or that the market simply hasn’t reached a true capitulation phase yet.

“The onchain data suggests the market has undergone a meaningful reset,” Cipolaro wrote.

But whether the low is already in place “likely depends on whether institutional demand has structurally altered the cycle or merely delayed a deeper reset,” he added.

A quick review of the Ways and Means tax bills: State of Crypto

0

The House Ways and Means Committee circulated seven draft bills ahead of this week’s hearing on crypto tax policy, signaling what the industry can expect.

You’re reading State of Crypto, a CoinDesk newsletter looking at the intersection of cryptocurrency and government. Click here to sign up for future editions.

The narrative

The House Ways and Means Committee is the group of lawmakers tasked with writing laws governing taxes. While we’ve seen draft bills addressing taxes already, it’s this committee that’s really going to handle a hefty part of the work of drafting crypto tax legislation and shepherding it through the legislative process.

Why it matters

The fact that the committee is at the point of discussing draft legislation in a hearing shows progress on this front, and it’s likely the provisions will eventually become law in the coming years, whether as part of a tax-specific legislative package or as part of some other, broader bill.

Breaking it down

Staking and mining, de minimis and stablecoin transactions are all covered in the draft bills circulated late Thursday by the House Ways and Means Committee, among various other issues.

It’s unclear how much progress will be made in terms of actually turning these bills into law in the 2026 calendar year. The House — and Senate, for that matter — has a number of other priorities that are more advanced and require floor time, as CoinDesk has covered before. Still, the existence of the draft bills and a hearing are important steps.

Alison Mangiero, the head of industry affairs and U.S. policy at the Crypto Council for Innovation, an industry trade group, said in a statement that the group of bills was an “important first step.”

“The Ways & Means Committee’s decision to release seven bills and follow with a full committee legislative hearing on June 9 is significant on procedural grounds alone,” she said. “This format, where members work through specific legislation with expert witnesses before any markup, is one the Committee has not used in years. That kind of deliberate, structured engagement represents the unique focus from the Committee on this important work.”

Mangiero called the bills the third leg in the metaphorical three-legged stool of crypto legislation, with the other legs including the stablecoin-focused GENIUS Act and the market structure-focused Clarity Act (the latter of which, as we all know, is still elbow-deep in the legislative process).

“Several provisions in this package reflect priorities we have long advanced: sensible tax treatment for GENIUS-compliant stablecoins that allows them to function as the payments instruments they are; a de minimis exception for routine network transaction fees, a relief we have long advocated for, and believe should be further broadened as the process continues; parity provisions extending securities lending, mark-to-market, and charitable deduction treatment to widely traded digital assets; and clear rules for the taxation of mining and staking rewards,” she said.

In semi-related news, the Financial Accounting Standards Board’s Investor Advisory Committee also met late last month to discuss, among other issues, whether stablecoins qualify to be treated as cash equivalents.

The committee believes there needs to be a “high threshold” to establish something as a cash equivalent, according to a summary of the meeting shared with CoinDesk. The members of the committee did not come to a consensus about what kind of information would be useful for investors.

Possible disclosure information includes how reserves are structured, the type of stablecoin, who the issuer is, where funds are held, disaggregated information about cash equivalents and currency risk and even whether disclosed information was made on an interim basis.

The committee will meet again in November.

Tuesday

  • 18:00 UTC (2:00 p.m. ET): The House Ways and Means Committee will hold a hearing to discuss crypto tax policy.

If you’ve got thoughts or questions on what I should discuss next week or any other feedback you’d like to share, feel free to email me at nik@coindesk.com or find me on Bluesky @nikhileshde.bsky.social.

You can also join the group conversation on Telegram.

See ya’ll next week!

ETF flows tell a different story

0

Bitcoin is back to trading at levels seen in early February: near $60,000. But this time, the response from institutions is totally different.

Today, they are aggressively selling into the dip, ETF flows indicate, unlike in February, when selling slowed as prices dropped to near $60,000. That marks a fundamental shift in how institutions view bitcoin at this level.

The 11 U.S.-listed spot bitcoin ETFs saw net outflows of $1.72 billion last week. That’s the largest single-week redemption in over a year, according to data source SoSoValue. Back in the first week of February, when BTC crashed to nearly $60,000, the ETFs bled just $318 million.

The bearish contrast doesn’t end there.

Outflows have accelerated for four consecutive weeks, rising from $1 billion in the week ended May 15 to $1.26 billion and $1.42 billion in the following two weeks, and most recently $1.72 billion.

In February it was different. The week BTC hit $60,000, ETFs saw $318 million leave. But the two weeks before that had seen $1.33 billion and $1.49 billion leave. In essence, as the price crashed, outflows slowed. Buyers showed up.

This time, the trend has reversed: As prices fell, outflows accelerated. Week after week, faster redemptions and no institutional bid beneath them.

The pattern tells a bearish story and suggests the bulls may have tough time holding on to the $60,000 support. As of writing, bitcoin changed hands near $62,000.

Bitcoin 2026 Bear Market Needs Months to Spark Capitulation Bottom

0

Bitcoin (BTC) threatens to “purge further” as realized losses in the 2026 bear market fail to beat records.

Key points:

  • Bitcoin realized losses have not yet surpassed the 2022 total despite market cap being higher.
  • History suggests that a fresh round of capitulation should occur before a bear-market bottom appears.
  • Retail investor conviction is still “remarkably high” despite new macro lows.

Bitcoin bear market bottom may need “a few more months”

New data from onchain analytics platform CryptoQuant shows that investor capitulation has not yet matched the levels of the 2022 bear market.

“Realized losses are calculated in USD, so logic would dictate that with similar behavior, USD losses during bear markets should be increasingly significant given that market capitalization keeps growing,” contributor Darkfost wrote in a post on X.

Realized losses refer to coins moving onchain at a lower price compared to their previous transaction — a telltale sign that an investor is selling their holdings at a loss.

In the 2022 bear market, such realized losses hit $211 billion, marking a new record. This year has yet to beat it, despite the Bitcoin market cap being higher in US dollar terms.

“Today, since the October top, approximately $174B in losses have already been realized,” Darkfost continued.

Bitcoin bear market realized loss comparison. Source: Darkfost/X

already differs from past bear markets in terms of
The result could be that a fresh round of loss-making market exits enters in order for historical patterns to be preserved.

“This may suggest that the market could purge further, although this remains fairly subjective,” Darkfost concluded. 

“If the bear market were to extend a few more months, it is possible that we could surpass the 2023 losses, but for now we have not yet reached that level, even though this bear market is already well advanced.”

Retail optimism suggests that the BTC price floor is not in

2026 already differs from past bear markets in terms of investor participation.

Related: Bitcoin needs one more thing to happen to spark BTC price ‘rally:’ Analysis 

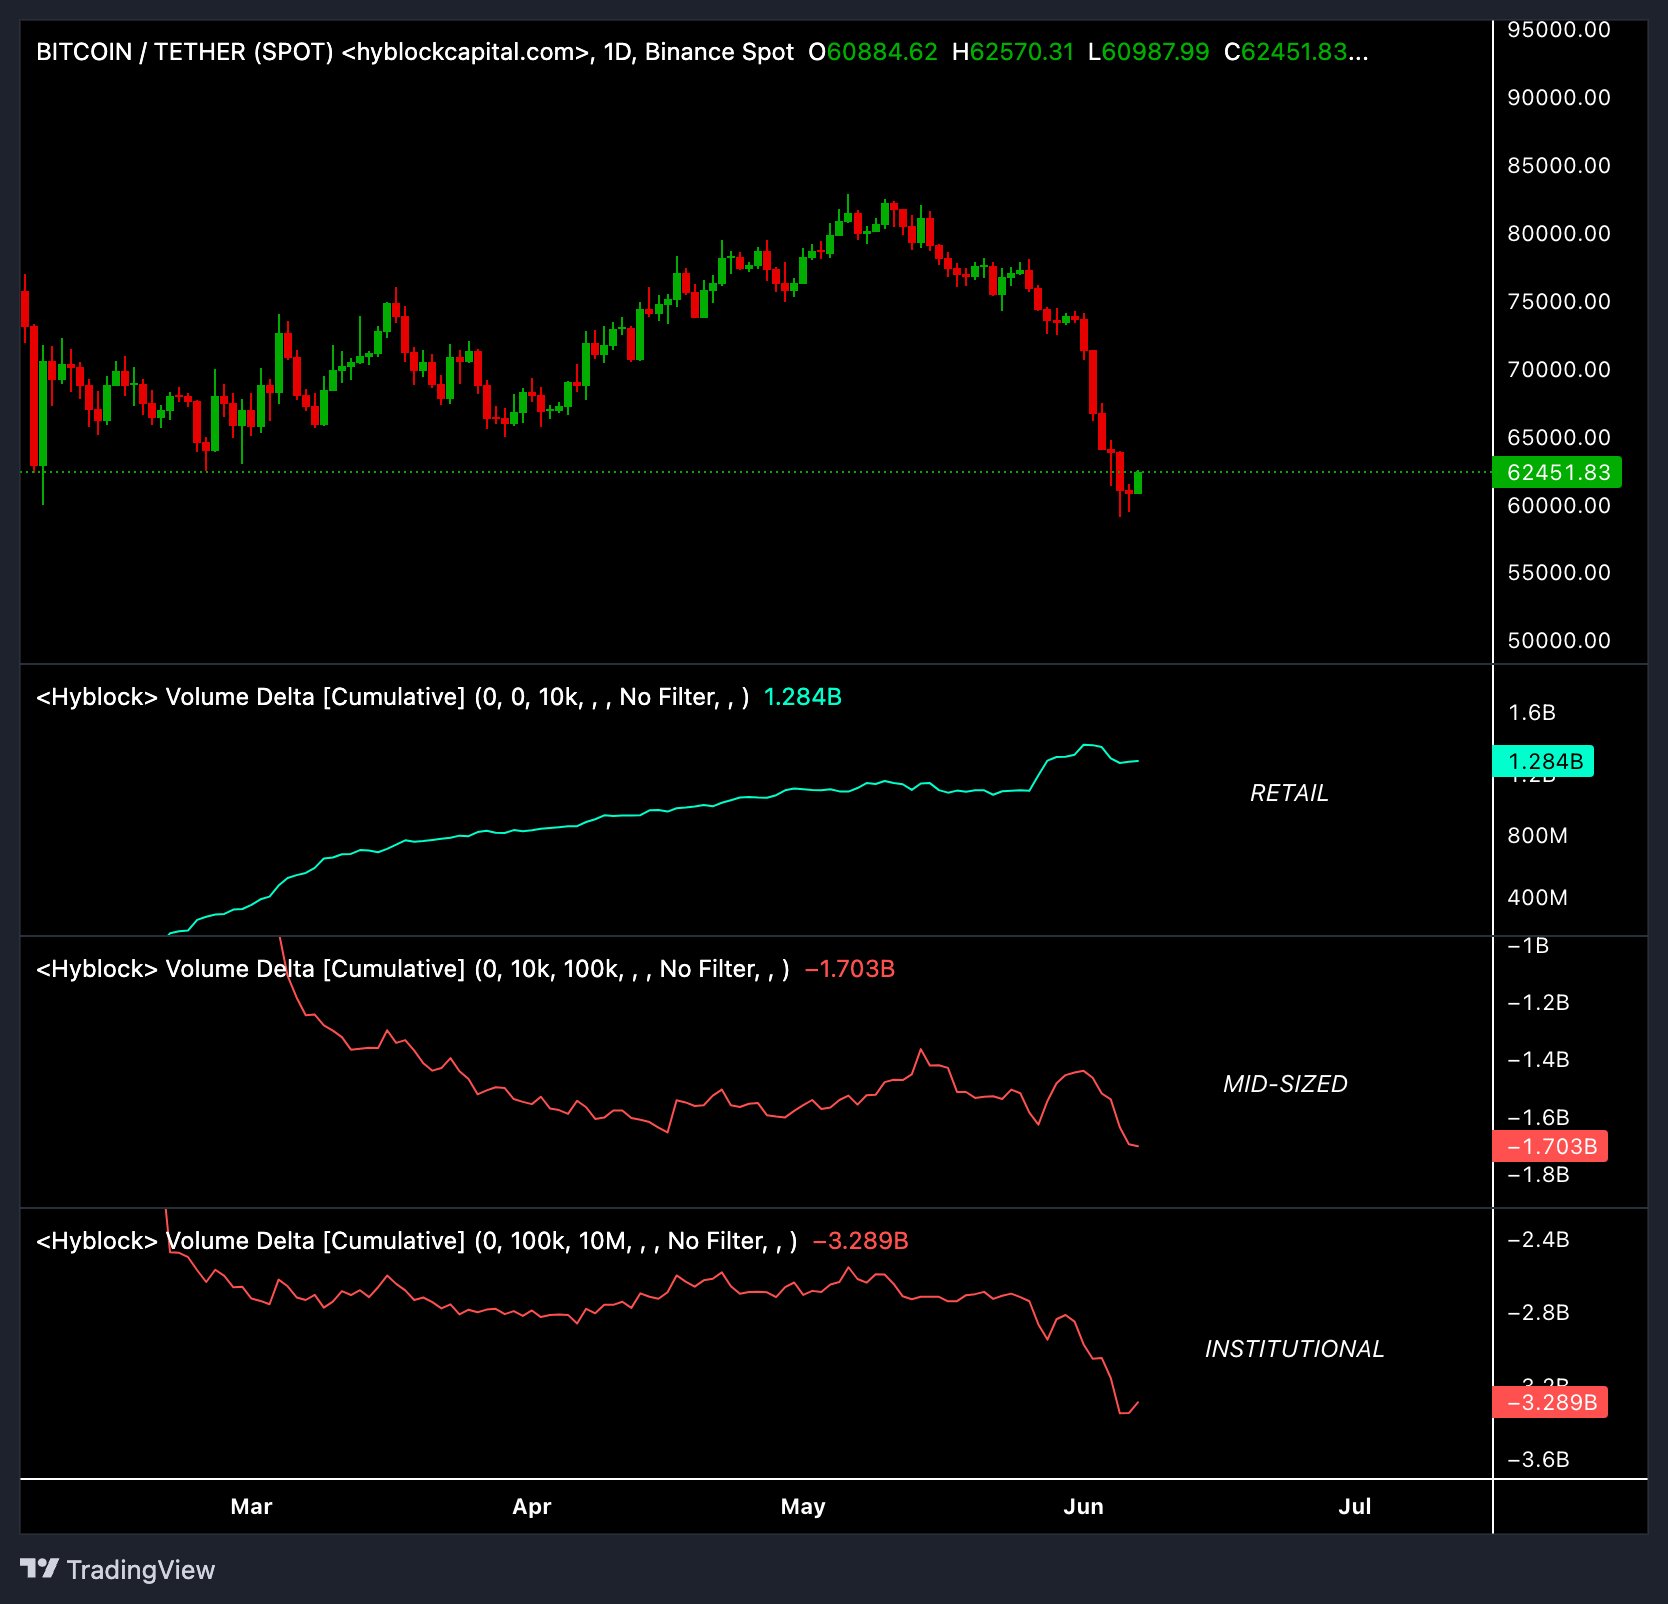
As trader and commentator Ardi notes, retail investors are attempting to catch a falling knife, entering and exiting while the price keeps falling. Institutions, by contrast, have sold relief bounces, offloading supply onto retail.

“Retail has spent months buying every ‘dip’ the market has given them, thinking the bottom was being handed to them on a silver platter. Mid-sized and institutional participants have spent that same period selling into their hopium,” Ardi explained on Sunday. 

“The people with the least capital are absorbing supply from the people with the most. That is not usually how major bottoms are built.”

BTC/USDT one-day char with order-book data. Source: Ardi/X

Ardi described “remarkably high” conviction among retail traders, which, like realized loss data, casts doubt on current BTC price lows as a reliable bear-market bottom.

“Until that dynamic changes, it’s difficult to argue that true capitulation has occurred,” he added.