Home Blog Page 144

Kalshi Reports 150+ Insider-Trading Investigations in Q1, Rolls Out Employer Checks for High-Risk Markets

0

Kalshi opened more than 150 insider-trading investigations in the first quarter of 2026, blocked over 100 potential insider trades, and referred at least 20 cases to law enforcement. The CFTC-regulated prediction market paired the numbers Tuesday with a new risk-scoring framework, employment-verification requirements for traders on high-risk markets, and expanded whistleblower tools.

Kalshi opened more than 150 insider-trading investigations in the first quarter of 2026, blocked over 100 potential insider trades using automated screening tools, and referred at least 20 cases to law enforcement. The CFTC-regulated prediction market paired the numbers Tuesday with three new compliance tools effective immediately.

The figures come from a June 9 post on Kalshi’s news site by Head of Enforcement Robert DeNault. Kalshi also reported five formal disciplinary actions taken in Q1. The new measures include a risk-scoring framework applied to every proposed market before listing, an employment-verification requirement for traders on high-risk markets, and expanded whistleblower tools on every market page.

The Enforcement Picture

Kalshi’s Q1 statistics mark a step up from the pace disclosed earlier this year. A February enforcement post noted 200 investigations opened over the prior twelve months, with a dozen-plus reaching active-case status. By the end of Q1, pre-trade screening tools alone had blocked more than 100 trades before execution.

The public disciplinary record now spans several categories of insider abuse. In February, Kalshi described two closed cases: a California governor candidate who traded about $200 on his own race (5-year ban, financial penalty equal to 10 times the initial trade), and a YouTube show editor who traded about $4,000 on streaming-platform markets where he had access to non-public scheduling information (2-year suspension, 5 times the trade in penalty). In April, three more political insider-trading cases surfaced involving congressional primary candidates in Minnesota, Texas, and Virginia who had bet on their own elections.

The highest-profile case to date sits outside the formal enforcement count. Federal authorities, including the CFTC and DOJ, are investigating former Congressman George Santos for allegedly using advance knowledge of his own absence from Trump’s State of the Union address to profit on a Kalshi contract, according to NPR and CNN. Kalshi froze Santos’ account and made a law-enforcement referral. Santos’ profits were reported in the tens of thousands of dollars.

New Tools: Risk Scoring and Employment Verification

Tuesday’s measures follow recommendations from Kalshi’s independent Surveillance Audit Committee, which was established in February. The committee’s first quarterly report drove the three rollouts.

The risk-scoring framework evaluates each proposed market across six dimensions before listing: corporate event or MNPI exposure, outcome concentration (how many people can influence the result), market importance, regulatory compatibility, non-traditional insider risk, and national security risk. Markets scoring high on the national security dimension may be rejected for listing outright, Kalshi said.

For markets that clear listing review but still carry elevated insider risk, traders must now complete an online employment disclosure before placing bets. Kalshi said it will not query the form unless suspicious activity triggers a review, but traders matching the profile of presumptive insiders will be screened out before a trade clears. Markets tied to corporate KPIs, foreign policy, and geopolitical flashpoints were cited as examples subject to the requirement.

The whistleblower expansion adds a direct reporting line to Kalshi’s surveillance team on every market page. The team monitors the public order book around the clock.

Prediction-Market Integrity Crackdown

Kalshi’s crackdown runs parallel to several other active prediction-market integrity threads. The CFTC is preparing a new rule that would permit most sports-event contracts while preserving its authority to block manipulation-prone markets, the WSJ reported earlier this month. A House Oversight probe into both Kalshi and Polymarket, opened by Rep. James Comer, is also underway.

The enforcement posture also predates a parallel case at Polymarket. A US Army soldier was charged in April with using classified information about US military operations in Venezuela to generate about $400,000 in profits on Polymarket, the first criminal prediction-market insider-trading case to reach indictment. That trial is scheduled for December.

Kalshi’s surveillance infrastructure draws directly from traditional exchange precedent. The company pointed to CME Group’s public discipline notices as the model for its own regulatory/notices page. Its surveillance partners include Solidus Labs and the Wharton Forensic Analytics Lab. Former Treasury official Brian Nelson is advising on market integrity and financial compliance.

“By implementing these new integrity measures, we continue to lead the industry on the issue of market integrity amongst federally regulated prediction markets,” DeNault said in the Tuesday statement.

Ripple-linked token above $1.10 as ETF inflows rise

0

XRP managed to hold the $1.10 area, which matters after last week’s sharp breakdown, but the recovery still looks tentative. Institutional money continues flowing into XRP-linked products and futures activity has picked up sharply, yet price remains pinned near multi-month lows while bitcoin and the broader market recover more aggressively.

News Background

• XRP-linked investment products attracted another $6.75 million in inflows, lifting cumulative ETF inflows to roughly $1.44 billion.

• The XRP Ledger’s version 3.2.0 upgrade is scheduled for June 15 and is expected to reduce server memory requirements by around 40% while rebranding the core software from “rippled” to “xrpld.”

• Futures activity surged to roughly $5 billion during the session, even as open interest remained near cycle lows, suggesting traders are actively repositioning rather than building long-term conviction.

Price Action Summary

• XRP gained about 1% during the 24-hour session, climbing to $1.1141 after recovering from lows near $1.11.

• The strongest move came late in the session when heavy volume pushed price through resistance around $1.1114 and briefly lifted XRP above $1.12.

• Earlier attempts to rally were rejected near $1.1352, leaving that level as the clearest near-term resistance zone.

Technical Analysis

• The most important takeaway is that XRP remains weak relative to the broader market. While the token posted a small gain, it underperformed major crypto benchmarks by nearly two percentage points.

• The late-session breakout above $1.11 was constructive, but it happened within a much larger downtrend that remains intact.

• Futures markets are sending mixed signals. Rising volume points to renewed trader interest, while subdued open interest suggests many participants are still reducing risk rather than aggressively adding exposure.

• XRP remains below its 50-day, 100-day and 200-day moving averages, meaning the broader technical structure continues to favor sellers despite signs of stabilization.

What traders should watch

• $1.10 remains the key support level. Holding above it keeps the recent stabilization attempt intact.

• $1.12-$1.13 is the first resistance zone, followed by $1.1352 where the latest rally stalled.

• A move above $1.26 would begin repairing the chart meaningfully and shift focus back toward the $1.30-$1.40 region.

• If XRP loses $1.05-$1.10 support, traders are likely to start discussing a move toward the psychologically important $1.00 level again.

Will BTC Price Keep Rising in June?

0

Bitcoin (BTC) erased its intraday losses and rose by around 2.5% to $62,410 immediately after the US inflation report, even as the headline Consumer Price Index (CPI) hit its highest level in more than three years.

BTC/USD hourly chart. Source: TradingView

Key takeaways:

  • Bitcoin rose as the latest US CPI reading matched economists’ expectations.
  • BTC still faces short-term downside risks as it trades below strong resistance levels.

May US inflation matched expectations

The US CPI rose 4.2% year over year in May. On a monthly basis, headline inflation increased 0.5%, while core inflation, which excludes food and energy, rose 2.9% annually and 0.2% month over month.

US headline and core CPI. Source: Bureau of Labor Statistics/Yahoo Finance

The headline jump came largely from higher energy and gasoline prices, as renewed Middle East tensions lifted oil prices and reignited inflation concerns.

At first glance, the report looked bearish for Bitcoin. Higher inflation usually reduces the odds of Federal Reserve rate cuts, keeps Treasury yields elevated, and tightens financial conditions. That typically pressures risk assets, including crypto.

But BTC rallied because the inflation print did not come in worse than feared.

Economists had already expected headline CPI to hit 4.2%. The actual number matched that forecast, removing the risk of a hotter surprise.

Traders did not see the report as strong enough to force the Fed into a tougher stance, giving them room to buy risk assets again.

That gave Bitcoin the chance to bounce from long-term support zones, including the 200-week exponential moving average (200-week EMA, the blue line) and the psychological $60,000–$62,000 price floor area, as shown below.

BTC/USD weekly chart. Source: TradingView

Is Bitcoin undergoing a bullish reversal?

Bitcoin’s post-CPI rebound does not yet confirm a full bullish reversal.

From a technical perspective, BTC still trades below key short-term resistance levels, including the 20-period SMA, shown in green, and the 50-period SMA, shown in red, on the four-hour chart.

BTC/USD four-hour chart. Source: TradingView

BTC also appears to be consolidating inside a bear flag pattern.

This setup forms when the price rebounds inside an upward-sloping parallel channel after a sharp decline. In simple terms, the bounce may only be a pause before the next leg lower, not the start of a new uptrend.

As a rule of technical analysis, a bear flag confirms when price breaks below the flag’s lower trend line. The measured downside target equals the height of the previous sell-off, projected from the breakdown point.

That puts Bitcoin’s bearish target near $57,800 in June, down about 7.6% from current levels.

Bitcoin relief bounce scenario also in play

Conversely, a clear breakout above the resistance confluence, comprising the 20-period SMA, the 50-period SMA, and the flag’s upper trend line, would weaken the bear flag structure and invalidate the immediate downside setup.

BTC/USD four-hour chart. Source: TradingView

In that scenario, Bitcoin could extend its recovery toward the $64,000–$68,000 range in June, aligning with the 0.236 and 0.318 Fibonacci retracement lines.

Soft core inflation gave crypto a bounce, but only bitcoin held up on the week

0

Crypto caught a modest bid on Thursday after Wednesday’s inflation report showed underlying price pressures staying contained. Bitcoin rose about 1.9% over 24 hours to roughly $62,600, leading the majors, per CoinDesk data.

Headline inflation rose 0.5% on the month and 4.2% over the year, the fastest annual pace since April 2023, but energy did most of the work, climbing 3.9% on the month and accounting for more than 60% of the increase as oil rose on the Iran conflict.

Core inflation, which strips out food and energy and is the gauge the Federal Reserve leans on, rose just 0.2% on the month, below the 0.3% forecast, and 2.9% over the year.

The bounce is shallow and concentrated in bitcoin. BTC is down less than 1% over the past seven days, holding its 200-week average, while the rest of the top tokens remain deep in the red on the week. Ether is off about 6.5% at roughly $1,651, XRP down 7.5% near $1.12, Solana down 7.4% around $65, and dogecoin off 7%. BNB held up better at a 2.1% weekly loss.

Traders now await Fed’s June 17 meeting, where markets expect no change to rates. The hot headline gives hawks cover to stay restrictive, while the soft core gives doves room to argue the pressure is narrow and energy-driven.

Another widely-cited catalyst is the public offering of Elon Musk-owned satellite, rockets and AI company SpaceX, which prices later Thursday and is expected to start trading on Friday at a $1.8 trillion valuation.

Shares for the company are already four times oversubscribed, with some singular entities bidding as much as $10 billion for the stock, per Bloomberg.

Bitcoin DAT buying collapses from $500 million per day to nearly negligeble

0

Bitcoin has lost buyers on two fronts.

The exodus from spot ETFs as a catalyst for the recent bitcoin price swoon is well documented. Less discussed is the equally steep drop in buying by digital asset treasuries, or firms whose core business is accumulating bitcoin as a treasury asset.

“As BTC broke down from the mid-$70Ks toward $60K, net inflows from corporate treasury firms fell sharply, with daily purchases slowing to a fraction of their recent pace,” analysts at Glassnode said in the latest market update.

“While companies remain net buyers overall, the decline in accumulation suggests this cohort is becoming more cautious, removing another source of marginal demand at a time when broader market sentiment remains weak,” they said.

The green and red bars show the dollar value of daily net purchases by digital asset firms since June 2025, smoothed using a seven-day moving average.

The DAT demand has pretty much evaporated this month, down significantly from multiple instances of over $500 million in daily accumulation observed through April and May.

That partly explains BTC’s quick slide from $74,000 to under $60,000 last week.

Some analysts believe the sell-off was mainly catalyzed by Strategy, the world’s largest publicly listed BTC holder, disclosing that it sold 32 BTC in the final week of May. The firm, however, returned to the market during last week’s sell-off, snapping up BTC worth around $100 million. But that failed to keep prices from falling below $60,000.

As of writing, bitcoin changed hands at around $62,500.

The U.S.-listed spot ETFs remain another major headwind, continuing to bleed capital and reducing the odds of a sustained price rebound. On Wednesday, the 11 funds posted an outflow of $213.85 million, according to SoSoValue. Total redemptions have exceeded $5.72 billion since the second week of May.

Bitcoin has reached a deep bear-market valuation zone

0

Bitcoin is trading near a level it has usually reached only late in bear markets, and it has held there even after the hottest U.S. inflation print in three years.

Checkonchain data show BTC fell toward close to its 200-week average, a rough four-year trend line watched by long-term holders. The model puts bitcoin in the bottom 10% of its historical valuation range, a zone that has appeared only during the deepest parts of past bear markets.

The mood in the market is just as washed out. The Crypto Fear and Greed Index – a measure of sentiment calculated using volatility, social media posts, and market volumes – sits at 9, deep in extreme fear, down from 11 last week and 48 a month ago.

Those readings usually show up when price-sensitive sellers have already done most of their selling. Checkonchain still warns that bottoms are a process where capitulation comes first followed by months of sideways trading that grind down the holders who stayed.

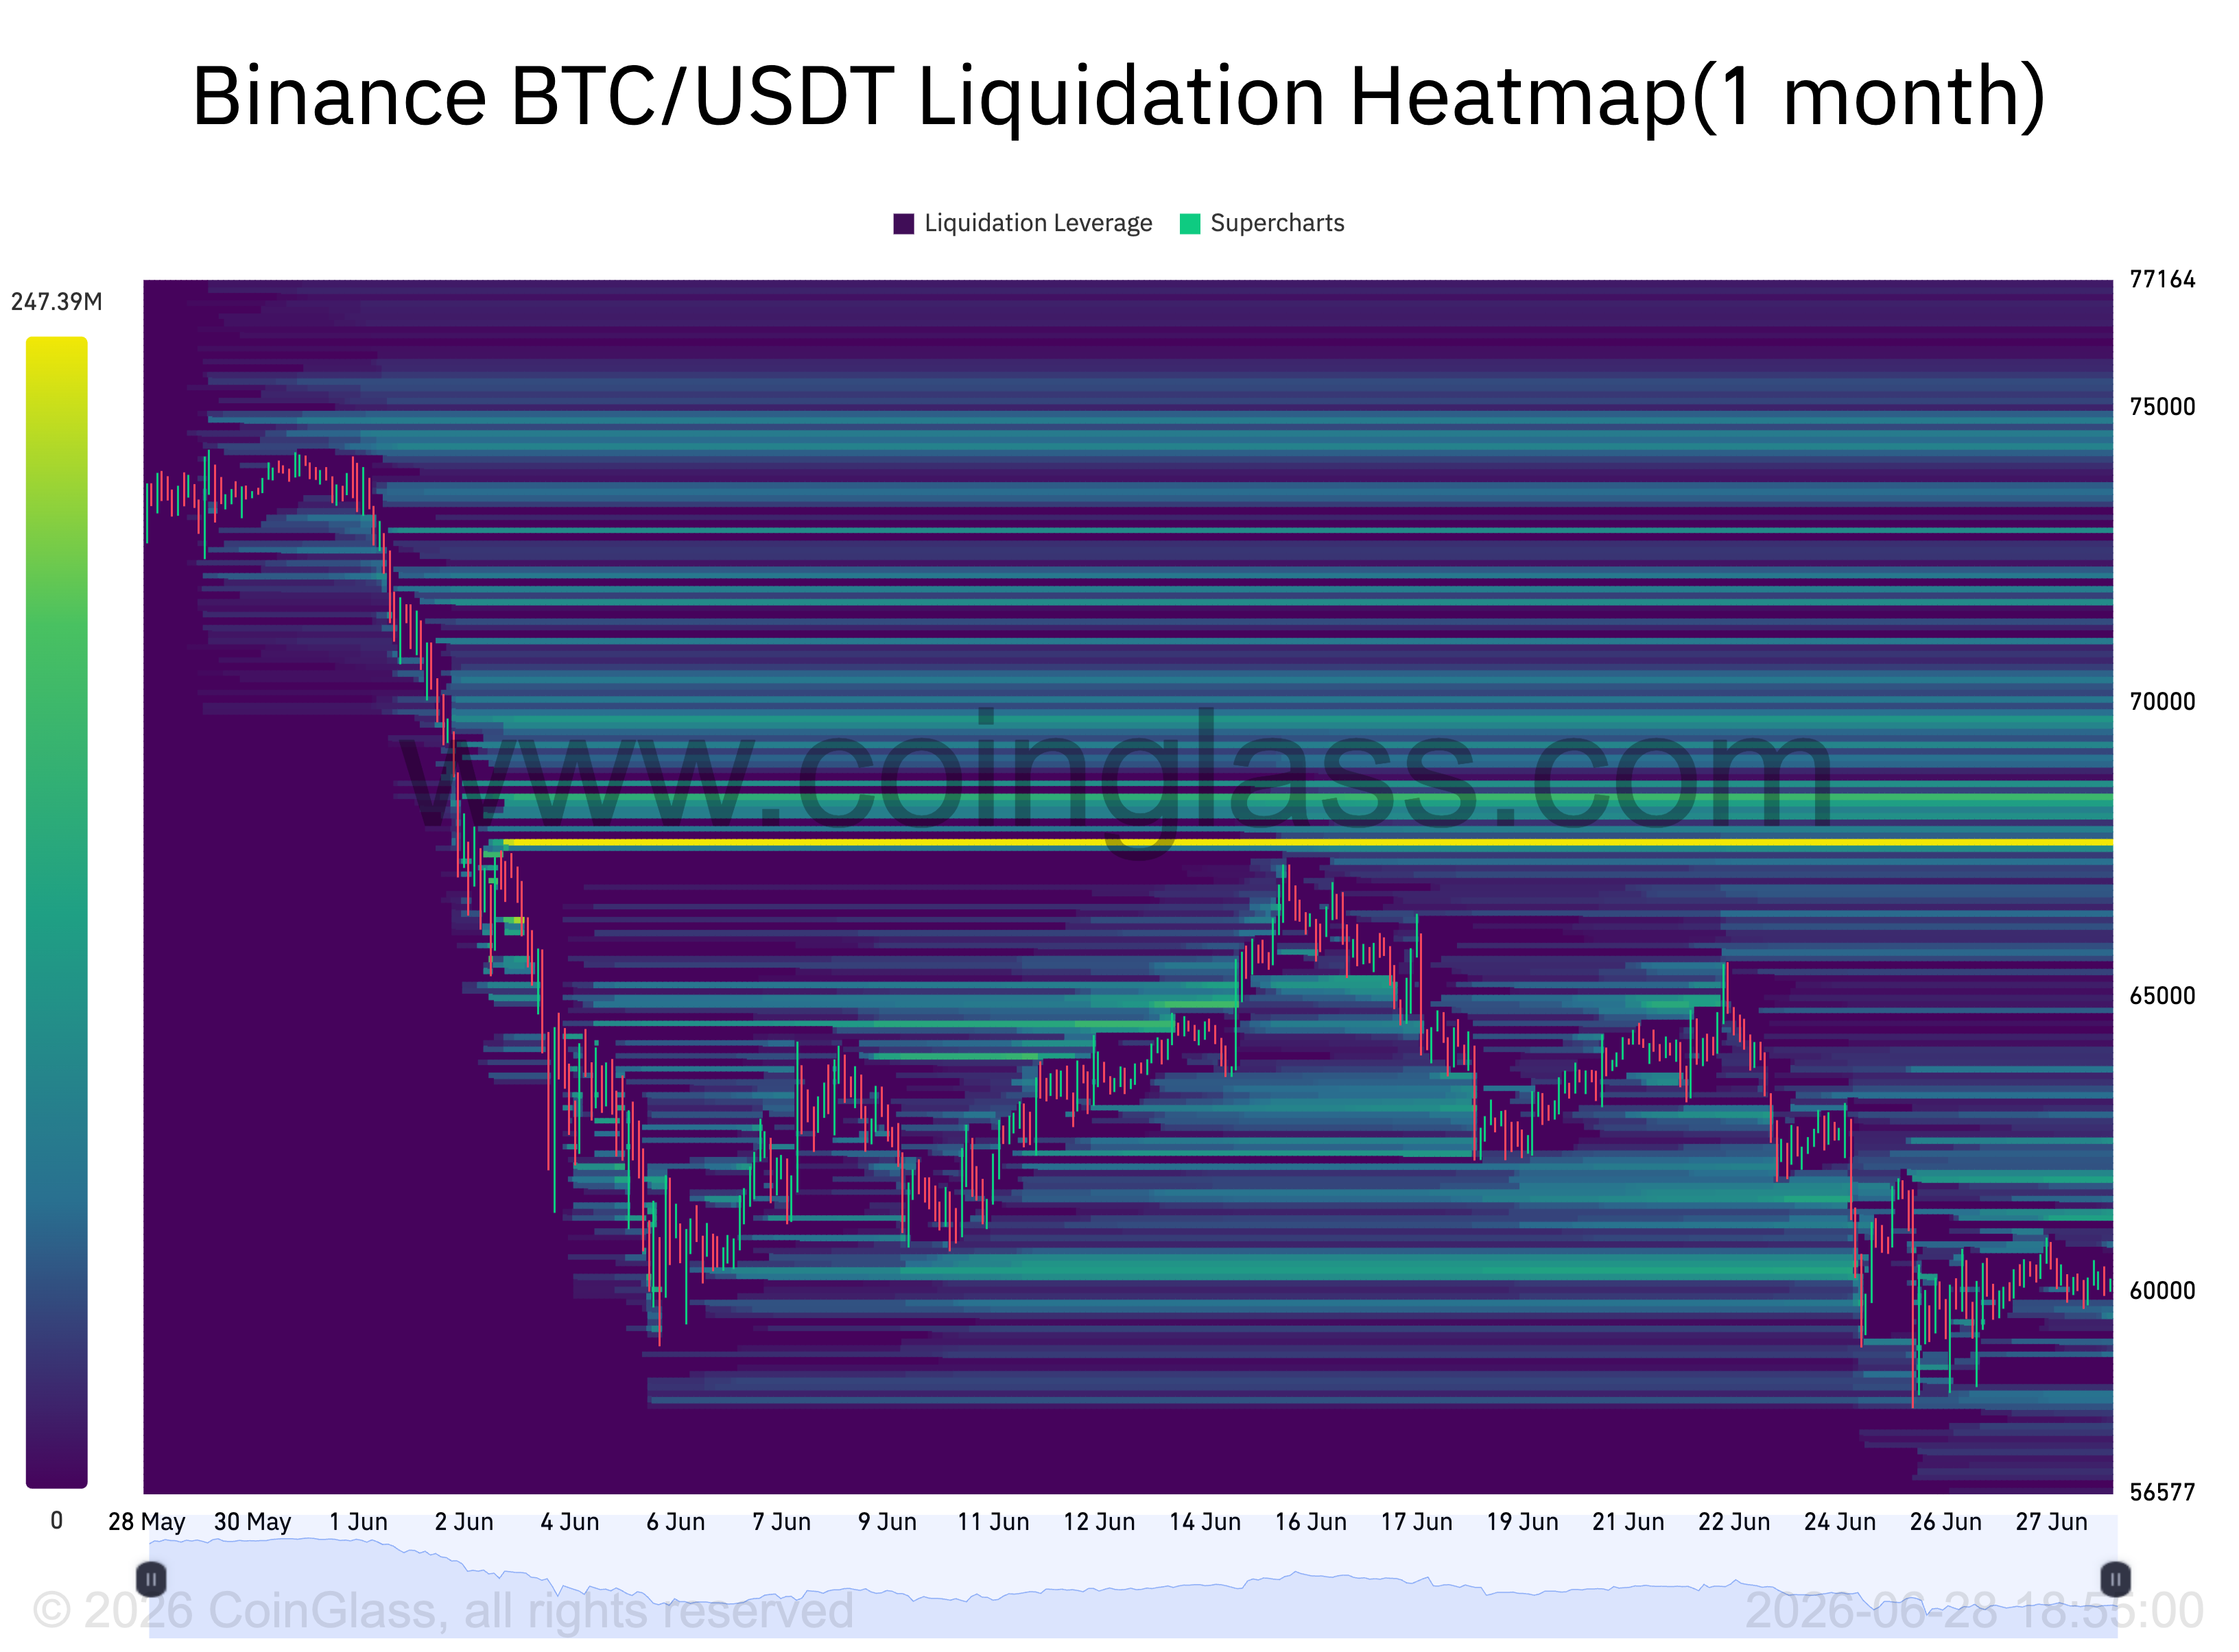
Bitcoin briefly broke below $60,000 this week for the first time since 2024 and changed hands at $62,623 on Thursday, up 1.9% on the day but lower over the week, with a record run of ETF outflows still pulling money out.

The bounce was broad but shallow. Ether rose 1.4% to $1,651, BNB added 1.3% to $595, solana gained 0.9% to $65 and dogecoin 1.1% to $0.085. XRP was the laggard, down 0.3% at $1.12. All of them remain lower over the past seven days, led by ether at 6.5% and XRP at 7.5%. Thursday’s gains dent the weekly slide rather than reverse it.

Inflation is not helping the case for a quick recovery. US consumer prices rose 0.5% in May from April and 4.2% from a year earlier, the fastest annual pace since early 2023, as the Iran war pushed up energy costs, according to Bureau of Labor Statistics data released Wednesday.

The core measure, which strips out food and energy, rose 0.2%, less than economists expected, the one soft spot in an otherwise hot report.

“Hopes for US regulatory clarity have faded again, with Polymarket odds of the Clarity Act passing in 2026 dropping from 62% to 48% this week,” Yves Renno, head of Trading at global crypto payments platform Wirex, told CoinDesk.

“All eyes now turn to the FOMC on June 16th–17th, and Warsh’s tone will be decisive in determining whether Bitcoin bounces toward $68–72K or breaks below $60K entirely.”

Meanwhile, the pressure runs well beyond crypto. Global equities fell to a more than one-month low this week as a technology-led selloff deepened and US forces struck multiple targets in Iran, collapsing the ceasefire that had held since April.

MSCI’s All Country World Index, the broadest measure of global stocks, slipped to its lowest since May 5, and its Asia Pacific gauge fell 0.8% to a three-week low. Brent crude rose 1.8% to about $95 a barrel. The European Central Bank is expected to raise rates later Thursday for the first time since September 2023, with bond traders pricing in higher borrowing costs worldwide.

Binance Stock Trading Draws 84% of First-Week Volume From Emerging Markets

0

Binance’s direct stock-trading platform drew more than 80% of its first-week volume from emerging markets, with assets under management crossing $400 million within seven days. The 2% share of TradFi-referenced perpetuals volume positions the June 1 launch as a distribution play for underserved retail users.

Binance’s direct stock-trading platform drew more than 80% of its first-week volume from emerging markets, according to data the company published this morning. The figures position the June 1 launch as a distribution play for underserved retail users, with a 2% share of TradFi-referenced perpetuals volume as the opening benchmark.

Assets under management in stocks crossed $400 million within the first seven days, Binance said in a press release published Wednesday. Emerging-market users generated approximately 84% of total trading volume, per Binance Research’s data thread published Tuesday on X.

Who Is Trading

One in four users was under 25. Nearly 40% of trades were placed for less than $100, and the minimum ticket is $5, against minimum deposits of $500 to $10,000 on many conventional brokerages. Around 10% of product-page visitors registered; roughly 64% of those sign-ups placed at least one trade. Seventy percent of users held positions rather than closing on the same day.

Shunyet Jan, Binance’s Head of Spot and Derivatives Business, said in the press release that the data shows user demand materializes in emerging markets, younger demographics, and trade sizes traditional platforms were not built to serve.

Where the Money Went

Information Technology captured 57% of sector allocation in week one. Semiconductors and hardware alone took roughly 44% of total inflows, a concentration Binance Research tied to user conviction around AI infrastructure. Funds and ETPs followed at 20%. Users traded across more than 1,100 assets; 124 of those each exceeded $100,000 in traded value.

Context

The week-one figures come nine days after Binance launched direct US equities trading for eligible non-US users, opening access to more than 7,000 US-listed stocks and ETFs through its ADGM-regulated broker Nest Trading Limited, with custody handled by Alpaca. That launch, covered by Converge on June 1, also previewed bStocks, a forthcoming tokenized-securities product issued through an ADGM-registered special purpose vehicle and pending regulatory approval.

Binance Research noted the crypto spot-to-perps ratio has historically run around 15%, framing that as the longer-term convergence target if direct equities trading scales. Whether the emerging-market skew and holding behavior persist beyond the launch window will determine whether the distribution thesis holds.

XRP Demand Falls 91.5% As Traders Eye $0.63 Support

0

XRP’s (XRP) onchain activity has contracted sharply since its 2025 peak. The 90-day network fee average fell by 91.5%, while the realized profit-to-loss ratio dropped to 0.38 from 50, according to Glassnode. 

The decline in activity and profitability comes as traders identify the $1.00-$0.65 region as a major area of interest.  

XRP profit-taking flips to network capitulation

According to Glassnode, the 90-day simple moving average of total fees paid on the XRP network has fallen to just 500 XRP from 5,900 XRP in February, a decline of 91.5%.

The network fees are often used as a proxy for transaction demand. The drop points to a sharp slowdown in activity following the speculative surge that carried XRP above $3 in the first half of 2025.

XRP total transaction fees. Source: Glassnode

XRP investor behavior has also shifted. Glassnode reported that XRP’s 90-day realized profit-to-loss ratio has fallen to 0.38, meaning market participants are realizing $1 in losses for every $0.38 in profits.

In January and July 2025, when the XRP price peaked near $3.40, the ratio reached 50 as profit-taking dominated the onchain flows. That balance has now reversed. This indicates that a larger share of onchain coins are being sold below their acquisition cost, a pattern commonly seen during capitulation phases.

XRP realized profit/loss ratio. Source: Glassnode

Exchange data offers a different view of holder activity. Crypto analyst Pelin Ay noted that transfers of more than 1 million XRP to Binance have declined since XRP’s 2025 peak. 

Historically, major corrections were preceded by sharp increases in both the 100,000–1 million XRP and 1 million-plus XRP inflow cohorts as large holders moved tokens to exchanges. 

The current data shows a sustained decline in exchange-bound XRP from large holders, with inflows from the 100,000–1 million XRP and 1 million-plus XRP cohorts decreasing by 15% and 20%, respectively, since October 2025. 

The analyst said the latest price weakness appears more closely tied to leverage-driven liquidations and risk-off sentiment than aggressive distribution by large holders.

XRP exchange inflows value bands on Binance. Source: CryptoQuant

Related: Arthur Hayes dumps WLD days after Maelstrom’s AI IPO pitch

$0.63 is the key area for accumulation

XRP’s weekly chart highlights a cluster of technical levels between $1.00 and $0.65.

A large fair value gap spans roughly $0.63 to $1.00, created during XRP’s rapid rally in late 2024. The price has already started moving back toward that zone after losing support near $1.40.

XRP/USDT, one-week chart. Source: Cointelegraph/TradingView

The visible-range volume profile data shows relatively light trading activity below current levels until a high-volume node around $0.50–$0.65. The point of control, which marks the price area with the highest traded volume, sits near $0.52–$0.55.

The same region aligns with XRP’s five-year ascending trendline, projected to intersect near $0.60–$0.65 in the coming months.

Some traders are already treating the zone as an accumulation range. Trader Crypto Patel identified $1.00 to $0.60 as a preferred buying range, while market analyst Javon Marks maintained his long-term breakout target of $15–$18, representing a 1,100% increase. 

XRP long-term analysis by Javon Marks. Source: X

Related: ETH crash to $1K looms if key support breaks: Will futures traders step in?

Michael Saylor gets into public back-and-forth with critics

0

Tempers are flaring as the bitcoin bear market deepens.

Strategy’s (MSTR) latest bitcoin purchase has sparked a public debate on X between Executive Chairman Michael Saylor and bitcoin advocate Matthew Kratter over whether the company’s most recent capital raise was accretive or dilutive for shareholders.

The disagreement centers on Strategy’s own bitcoin performance metric, BTC Yield, which is designed to track changes in bitcoin holdings per assumed diluted share. According to Strategy’s latest figures, BTC Yield fell from 13.0% on June 1 to 12.8% on June 8, after the company acquired an additional 1,550 BTC.

Kratter argued that the decline shows the transaction was dilutive on a bitcoin-per-share basis. Over the same period, Strategy’s bitcoin holdings rose from 843,706 BTC to 845,256 BTC, while assumed diluted shares outstanding increased from 382.756 million to 384.180 million. BTC Gain YTD also fell from 87,754 BTC to 86,328 BTC.

Saylor pushed back, saying BTC Yield is a narrow KPI that measures only bitcoin per share, not total shareholder accretion. Saylor said the transaction also added approximately $100 million of U.S. dollar reserves, taking the total USD reserve to $1 billion, making the deal accretive when both bitcoin and cash are included.

If viewed strictly through BTC Yield, the latest raise appears dilutive. But if cash reserves and broader balance-sheet effects are included, Saylor argues that the transaction improved shareholder value.

Others jumped in. “Notice they keep changing the rules to fit the financial alchemy they’re doing,” sniped Wazz. “First $BTC yield was boasted everywhere and plastered accross every buy announcement as the standard accretive metric. Now it’s a ‘narrow KPI’ which is irrelevant.”

“As a short seller, I’ve watched innumerable companies ‘move the goalposts,’ and try and focus the market on new metrics when old ones aren’t showing the story they want them to anymore,” wrote Quoth the Raven. “Sometimes, companies outright delete key performance indicators (KPIs) and use new ones.”

Lava Network Signs Tokenization Pact for Planned 40,000-Unit Caribbean Project

0

The agreement with developer BHL Group is an early-stage memorandum of understanding, and the Alba Bay community is not slated to break ground until 2027

Lava Network, a blockchain infrastructure protocol, has signed a preliminary agreement to help design a tokenization sandbox for Alba Bay, a planned Caribbean residential development of more than 40,000 units. Lava said it is the protocol’s first real-world asset mandate.

BHL says the project will span nearly 40 million square meters, cost multiple billions of dollars and target construction starting in the first quarter of 2027.

The arrangement is a non-binding memorandum of understanding, and BHL Group, the developer, pays Lava nothing upfront, the company said in written answers to questions from The Defiant. No units have been tokenized and no infrastructure has been deployed yet.

LAVA, the protocol’s token, trades more than 90% below its 2024 peak and has a market cap of about $9 million, according to CoinGecko. Lava routes traffic for enterprise users including Fireblocks, NEAR, Arbitrum and Starknet.

The release announcing the partnership described a “regulatory sandbox” that would put every home, parcel and shared asset onchain. Lava described a “private, exploratory process between the parties” that’s fully aligned with existing legal and regulatory frameworks.” It named no Dominican regulator and said any future implementation would be coordinated with authorities later.

Lava Support

Under the MoU, Lava’s role is to support ecosystem outreach, coordinate applications from crypto-native teams and contribute to the sandbox’s design, the company said. BHL retains control over the project’s direction and assets. Lava’s decentralized RPC and API services would be used only if the teams eventually chosen to build the tokenization framework opt for them. The commercial terms are usage-based, with no fixed fee, equity stake or token grant from BHL, Lava said.

The release said for residents “the deed of ownership will also be a digital asset from day one.” Lava said no tokenization structure has been defined, and that any token would be designed to complement rather than replace existing property registries, likely through special-purpose vehicles representing economic interests.

BHL assembled the land over 20 years through more than 100 parcel purchases and holds it outright, Lava said. Financing is mixed: traditional real estate investors are in the capital stack, with a further portion expected from crypto-native funds raised through the sandbox.

Lava said the sandbox’s team-selection process is expected to begin shortly. Whether the project proceeds to tokenization will depend on the results.