Bitcoin (BTC) hit week-to-date lows at Tuesday’s Wall Street open as analysis put $65,000 as bulls’ level to beat.
Key points:
- Bitcoin needs to revisit $65,000 for bulls to take charge, says new BTC price analysis.
- Bear market history continues to play out as BTC/USD loses key supports.
- Iran peace hopes see oil fall below $88 for the first time this month.
Bitcoin price copies bear-market history with support losses
Data from TradingView tracked 1.2% BTC price downside on the day as sell-side pressure returned ahead of key US inflation data.
A double rejection at $64,200 put BTC/USD on course for another test of the key $60,000 support level.
BTC/USD one-hour chart. Source: Cointelegraph/TradingView
Commenting, trader and analyst Michaël van de Poppe said that for bulls to gain the upper hand, they would need to crack $65,000.
“Bitcoin is stalling beneath $65K as breaking that level would trigger a strong run to $72-74K,” he wrote in one of his latest posts on X.
“The $65K support level was the previous level of support after the crash early in February and is now acting as the resistance to break through.”
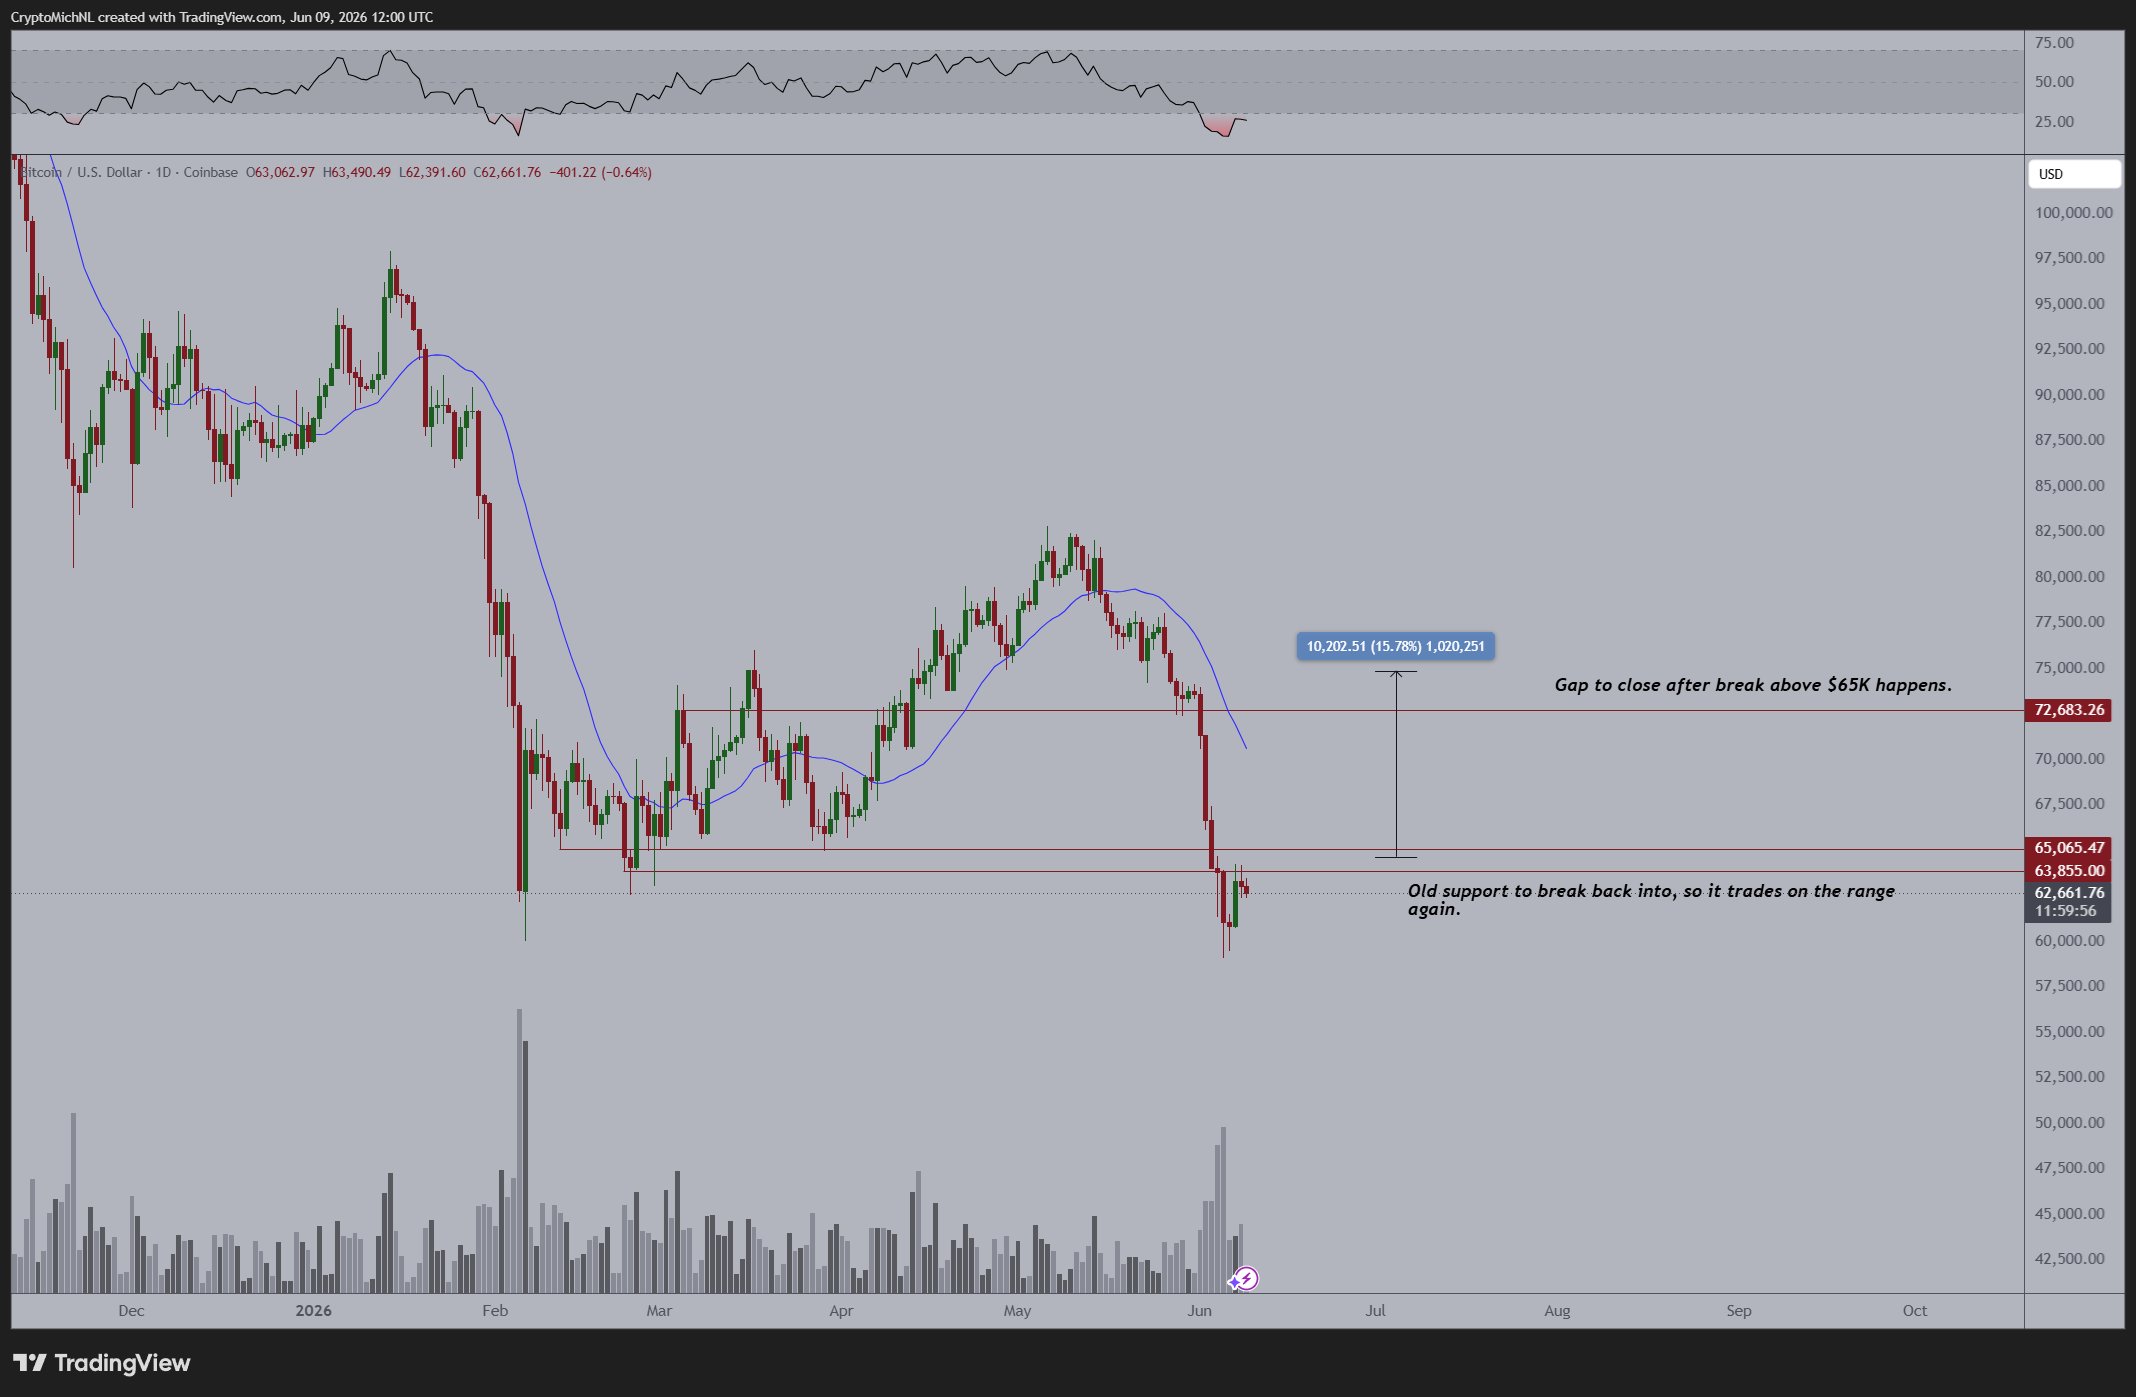
BTC/USD one-day chart. Source: Michaël van de Poppe/X
Van de Poppe called into question the validity of Bitcoin’s latest macro lows, which took the market to $59,100 last week.
“I don’t think it will take long before the markets will be doing this, as the recent selloff was relatively irrational,” he added.
In an update on the bear market, trader and analyst Rekt Capital flagged two more key similarities between current BTC price action and the road to previous cycle lows.
BTC/USD, he noted, had lost both its 50-month exponential moving average (EMA) and the support of a triangle construction — just like in 2018 and 2022.
“Now Bitcoin needs to fully confirm this breakdown to enter additional Bearish Acceleration to the downside,” he told X followers.
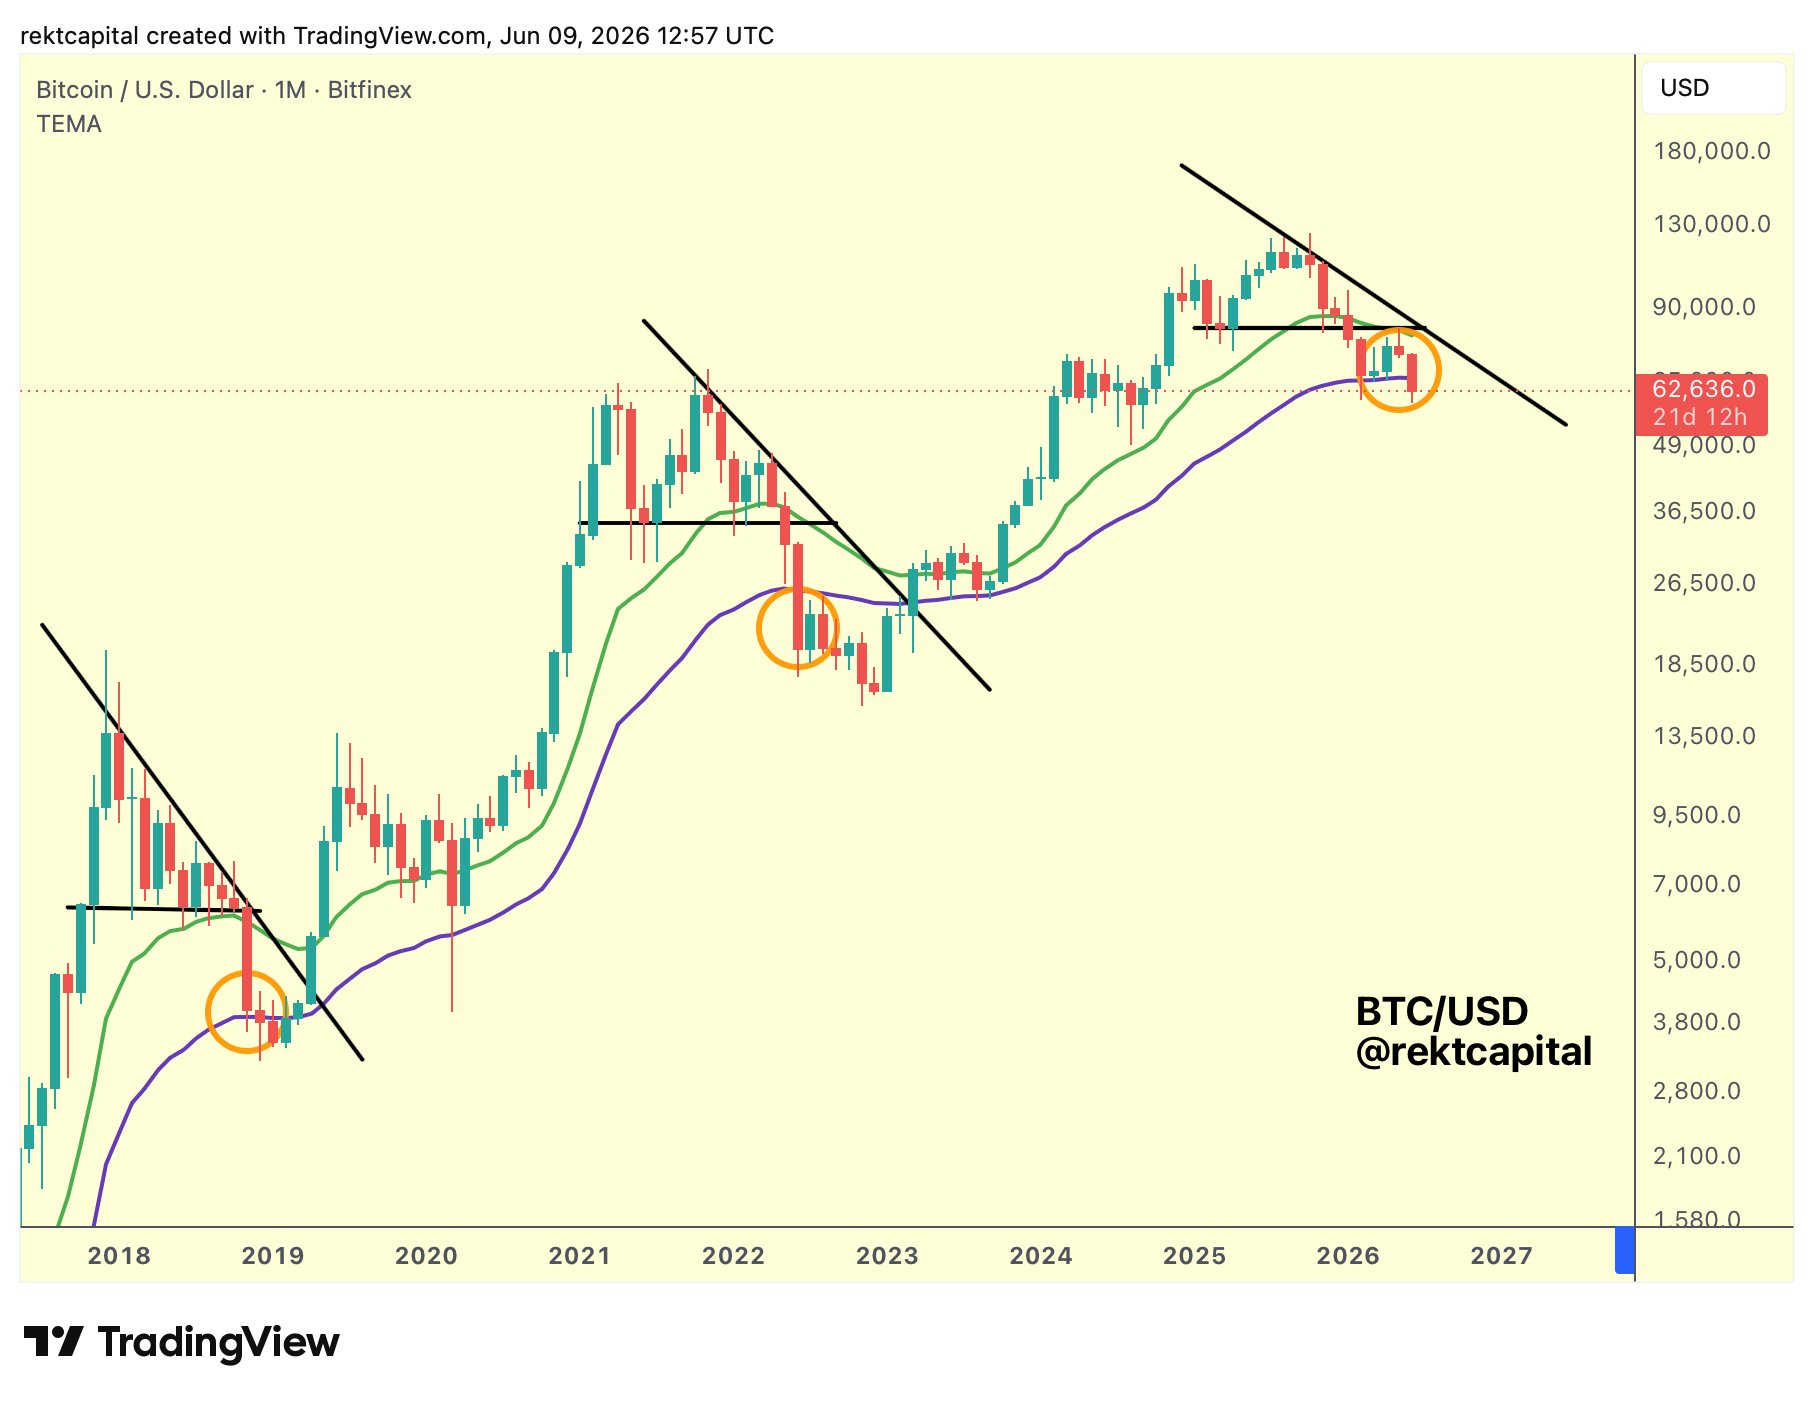
BTC/USD one-month chart with 21, 50 EMA. Source: Rekt Capital/X
Oil falls to June lows on new Iran peace momentum
Bitcoin once again diverged from US stocks on the day, heading lower while both the S&P 500 and Nasdaq Composite Index opened up by nearly 1%.
Related: Bitcoin ‘normal’ 4-year cycle puts focus on $53K low before 2028 BTC price high
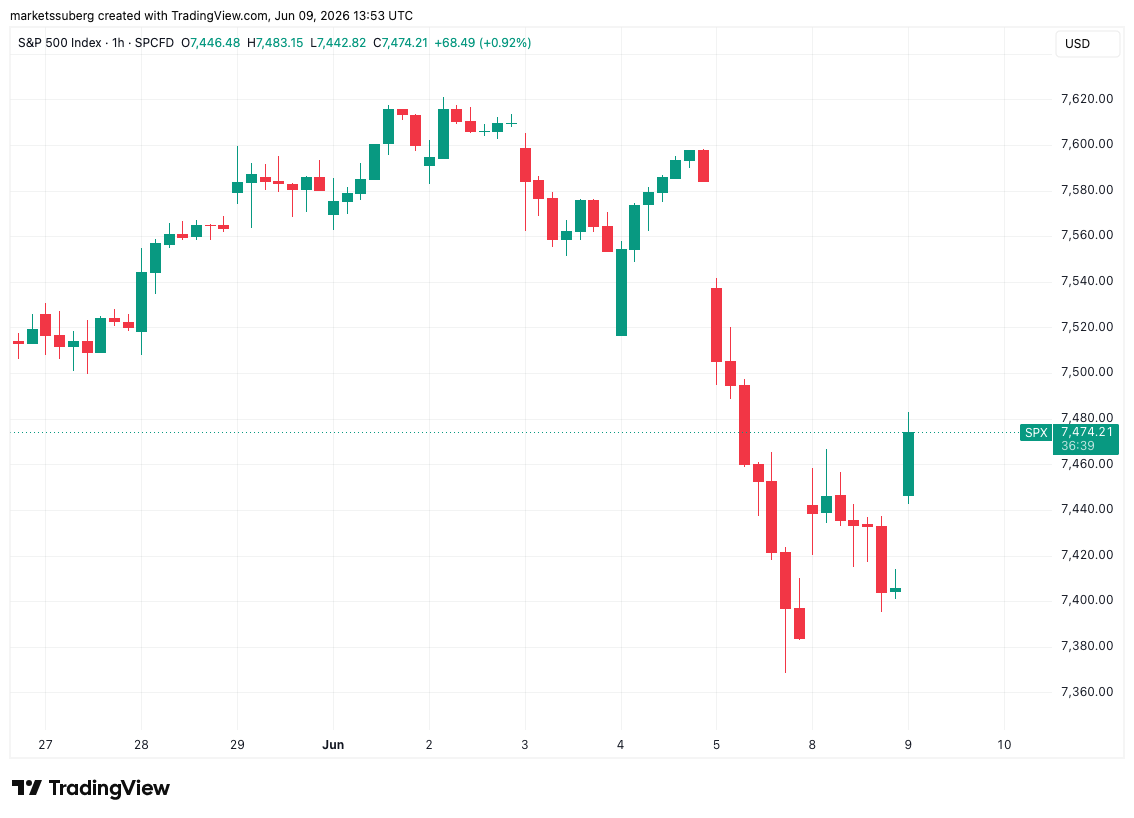
S&P 500 one-hour chart. Source: Cointelegraph/TradingView
This helped alleviate an initial drop at the start of the week after Asian markets came under pressure from a tech-stock rout.
Oil prices, meanwhile, also fell as hopes of a US-Iran peace deal steadily reemerged.
“It’ll be a total victory,” US President Donald Trump said in a telerally for Republican Senator Lindsey Graham on Monday, quoted by Al Jazeera and others.
“It’ll happen very soon, and oil prices will come tumbling down.”
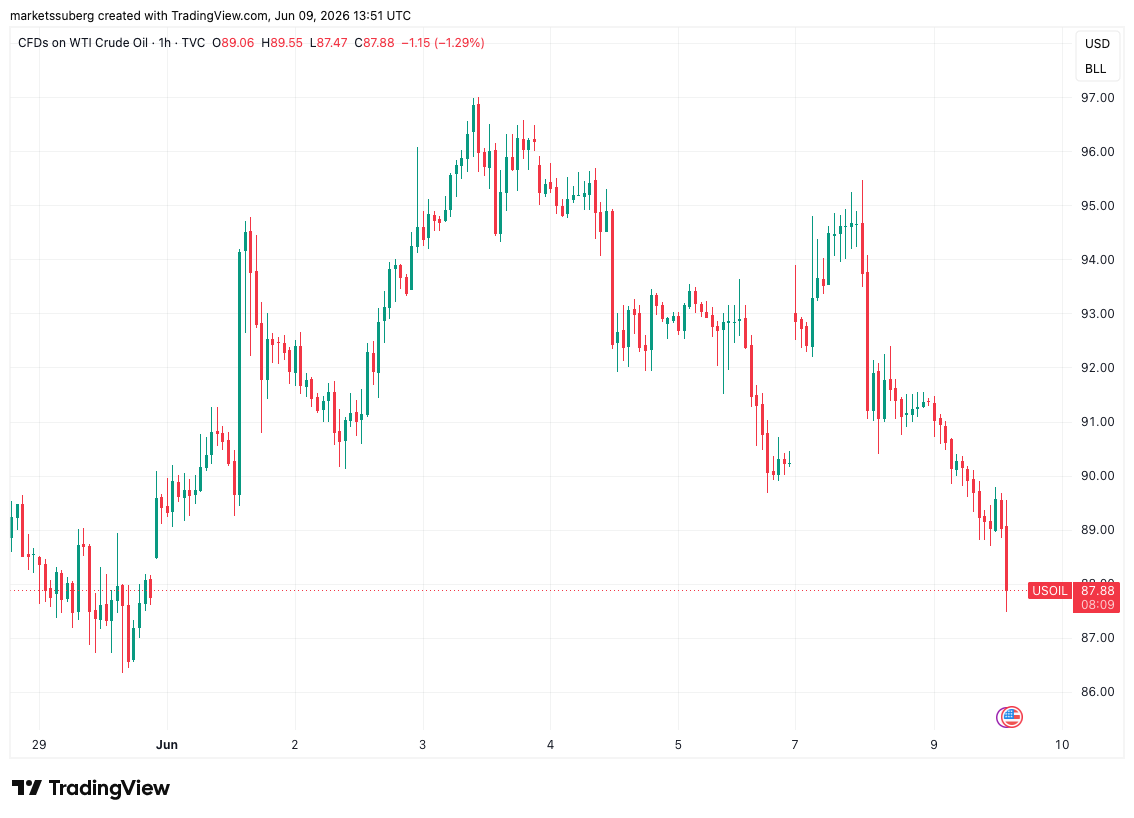
CFDs on US WTI crude oil one-hour chart. Source: Cointelegraph/TradingView
WTI crude dropped under $88 per barrel, reaching its lowest level since May 29.