


Bitcoin (BTC) has delivered a key trend change setup in the latest sign that the macro downtrend could soon reverse.
Key points:
- Bitcoin is seeing its first “perfected” TD9 indicator downtrend setup on monthly time frames since mid-2022.
- While not a “buy signal” on its own, the move marks a key inflection phase in the bear market, analysis suggests.
- RSI divergences continue to gain sway among those eyeing the final stages of the 2026 market downturn.
BTC price “perfected” TD9 setup echoes final bear-market stages
In an X post on Tuesday, analyst Tony Severino flagged a “perfected” buy signal on the TD9 indicator.
TD9 is a derivative of the Tom DeMark Sequential market timing indicator, which alerts traders to potential trend changes. Here, price triggers a notable signal when nine candles in a row close higher (in an uptrend) or lower (in a downtrend) than the closing price four candles prior.
“Bitcoin has ‘perfected’ a TD9 buy setup on the monthly,” Severino commented alongside data from TradingView.
BTC/USD one-month chart with TD9 indicator data. Source: Cointelegraph/TradingView
The setup is Bitcoin’s first in several years on monthly time frames, with the last TD9 downtrend signal coming in July 2022.
At the time, BTC/USD spent another five months ironing out its bear-market bottom, and as Severino notes, a completed TD9 setup does not “necessarily mean that the bottom is in.”
“Not a buy signal by itself. But if it holds into the close, it’s the kind of thing you pay attention to,” Tony Carrera, host of the Proof of Pain podcast, wrote in a further X post.
“TD 9s are where you stop chasing fear, zoom out, and ask: Is this where $BTC reminds everyone what happens when they think it’s dead?”
RSI divergences spark “good odds” for Bitcoin’s bullish comeback
As Cointelegraph reported, consensus among market participants still favors new macro lows coming before the bear market truly reverses.
Related: Bitcoin just $5K away from ‘best investment opportunity’ of bear market
Targets differ, with $55,000 now popular, while BTC price cycle comparisons put the current bear market at just over two-thirds complete.
By contrast, bullish divergences across multiple time frames are locking in on the relative strength index (RSI) — a classic hint that trend change is due.
“Not sure I have ever seen more confirmed and potential bullish divergence with oversold RSI on more time frames, ever,” trader, analyst and podcast host Scott Melker told X followers on Wednesday.
“Divs building over multiple time frames is my favorite signal. Good odds.”
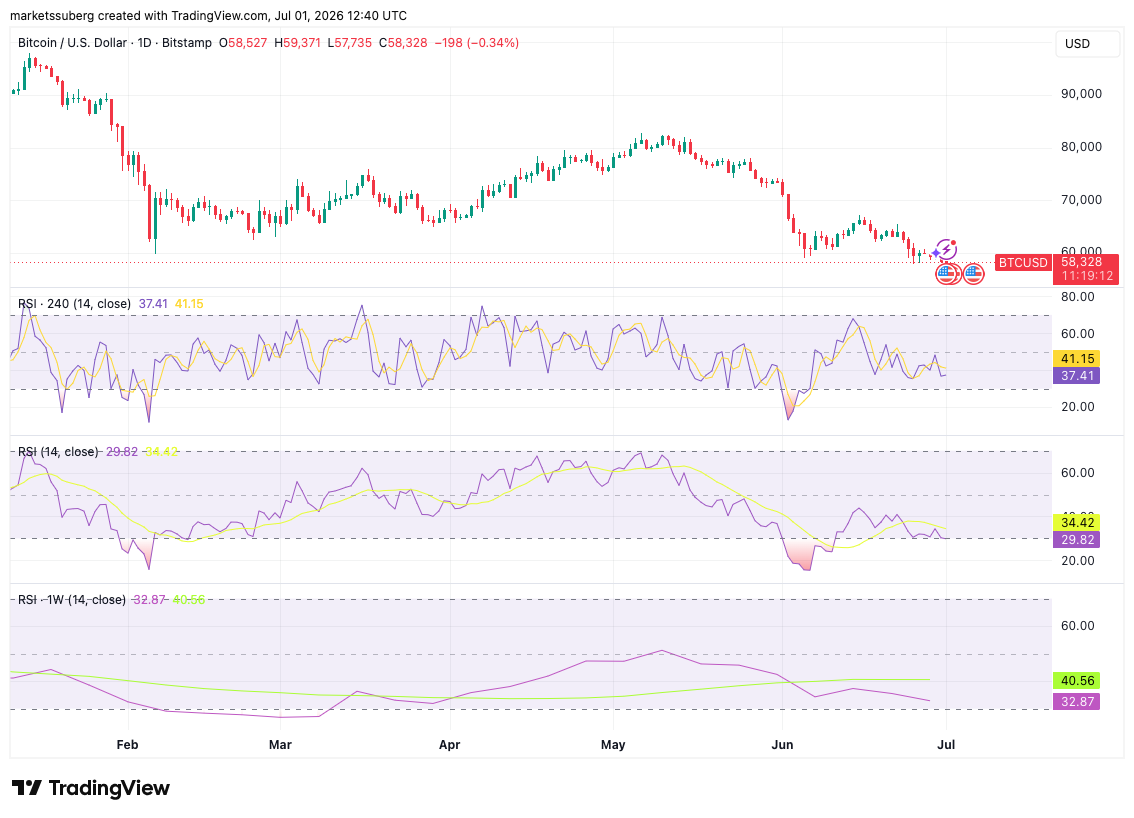
BTC/USD one-day chart with four-hour, one-day, one-week RSI data. Source: Cointelegraph/TradingView