


Bitcoin (BTC) returned below $64,000 after Thursday’s Wall Street open as bulls nursed 13.5% weekly losses.
Key points:
- Bitcoin struggles to stabilize amid its worst week of losses in 2026 so far.
- $60,000 is the line in the sand for bulls to defend, analysis says.
- BTC price action with a key trend line closely mimics the 2022 bear market.
Bitcoin “sellers remain in control” as $60,000 nears
Data from TradingView showed BTC price strength barely recovering after a slide to its lowest levels since early February.
BTC/USD one-hour chart. Source: Cointelegraph/TradingView
BTC/USD revisited its 200-week simple moving average (SMA) trend line at the lows, continuing to copy “classic” bear-market behavior from 2022.
“Continuation down after that bearish retest in the low $80Ks region,” trader Daan Crypto Trades wrote in a summary of the status quo on X.
“Clearly still a bigger down trend this has been in since October last year.”
Daan Crypto Trades said that the focus was now on $60,000 and its ability to sustain as support.
“Key area here in the low $60Ks least with the Weekly 200MA too,” he added.
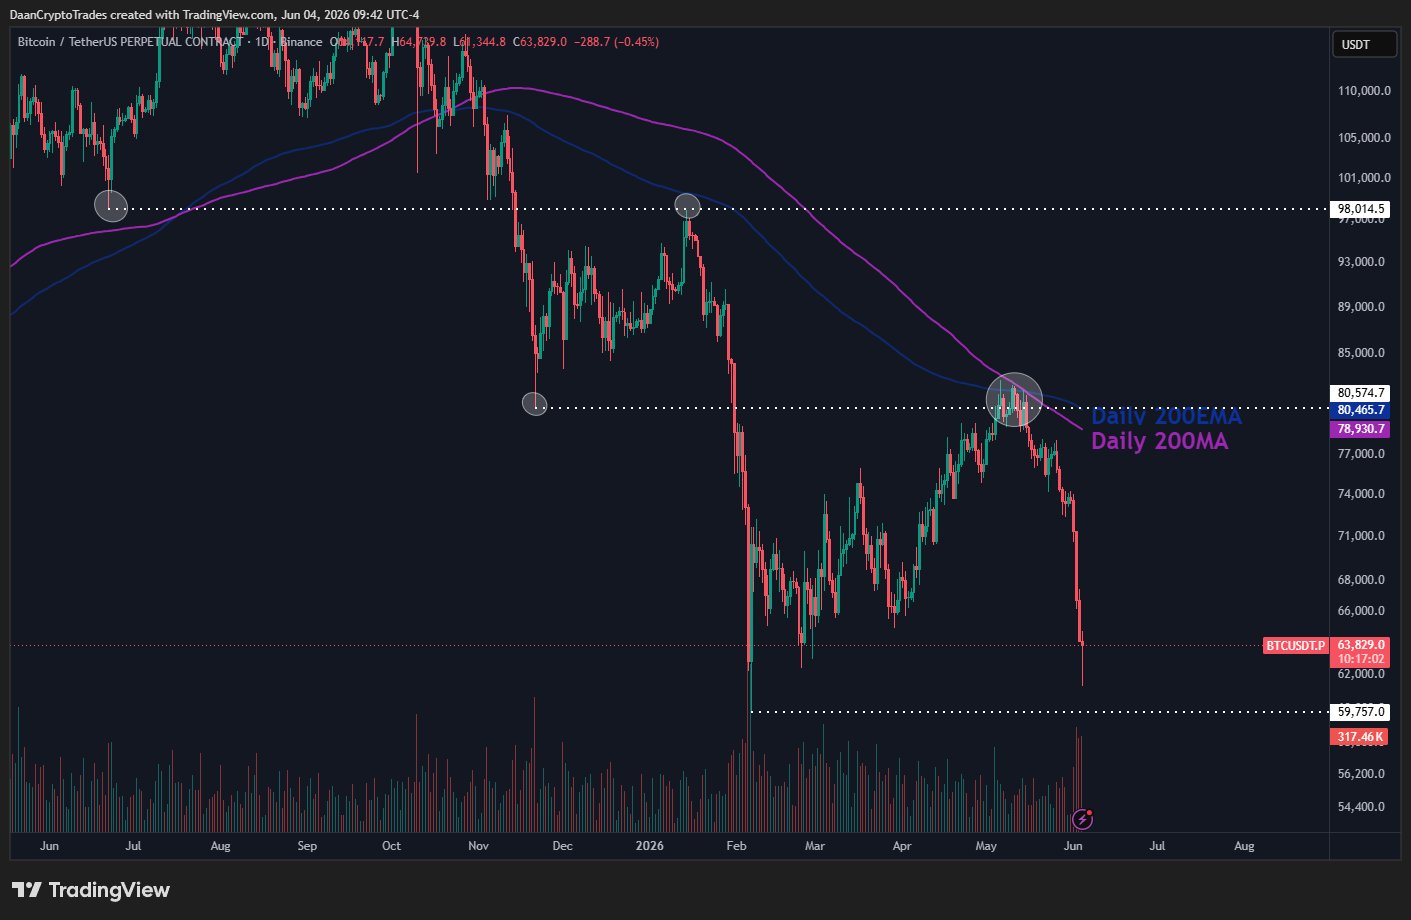
BTC/USDT perpetual contract one-day chart. Source: Daan Crypto Trades/X
Trading resource The Kobeissi Letter noted that since October 2025, crypto markets had shed more than $2 trillion in market up.
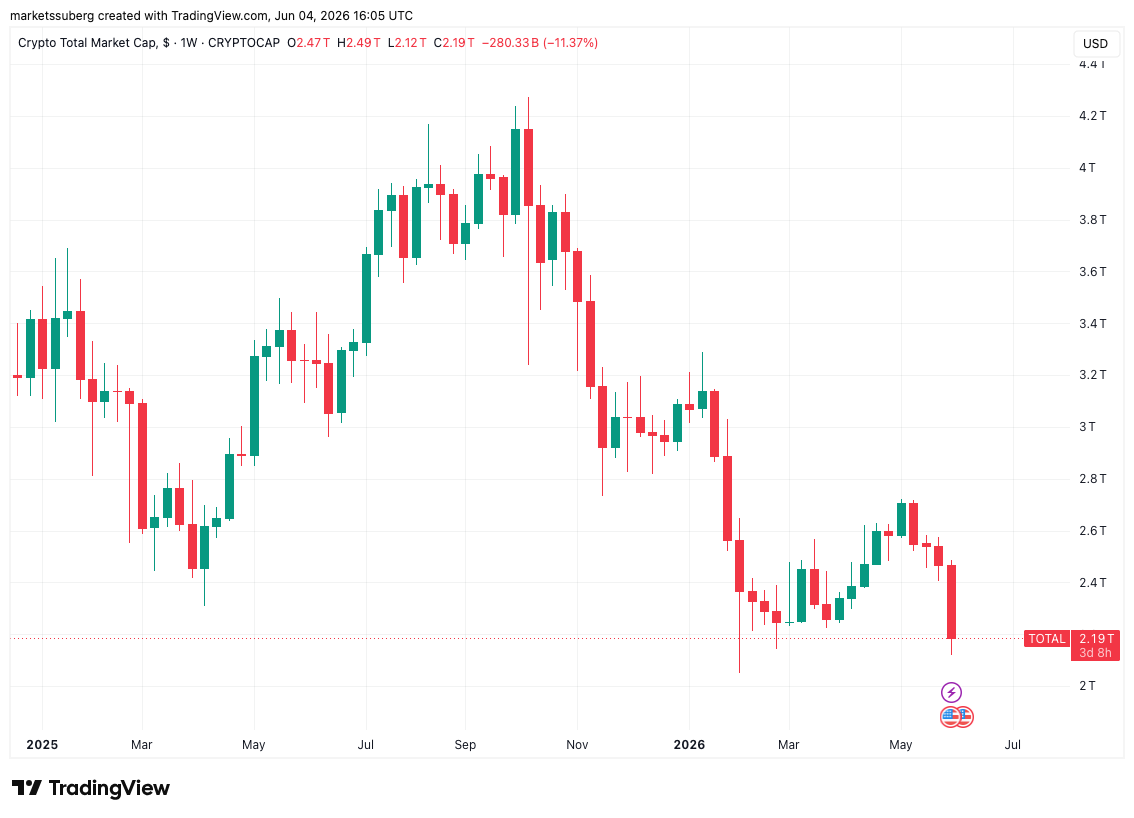
Total crypto market cap one-week chart. Source: Cointelegraph/TradingView
On short time frames, commentator Exitpump said that sellers still had the upper hand.
“Every bounce gets met with a wall of chasing asks on Binance perps orderbook. The moment buyers start pushing, more supply shows up overhead and keeps price pinned,” they told X followers.
“Sellers remain in control for now.”
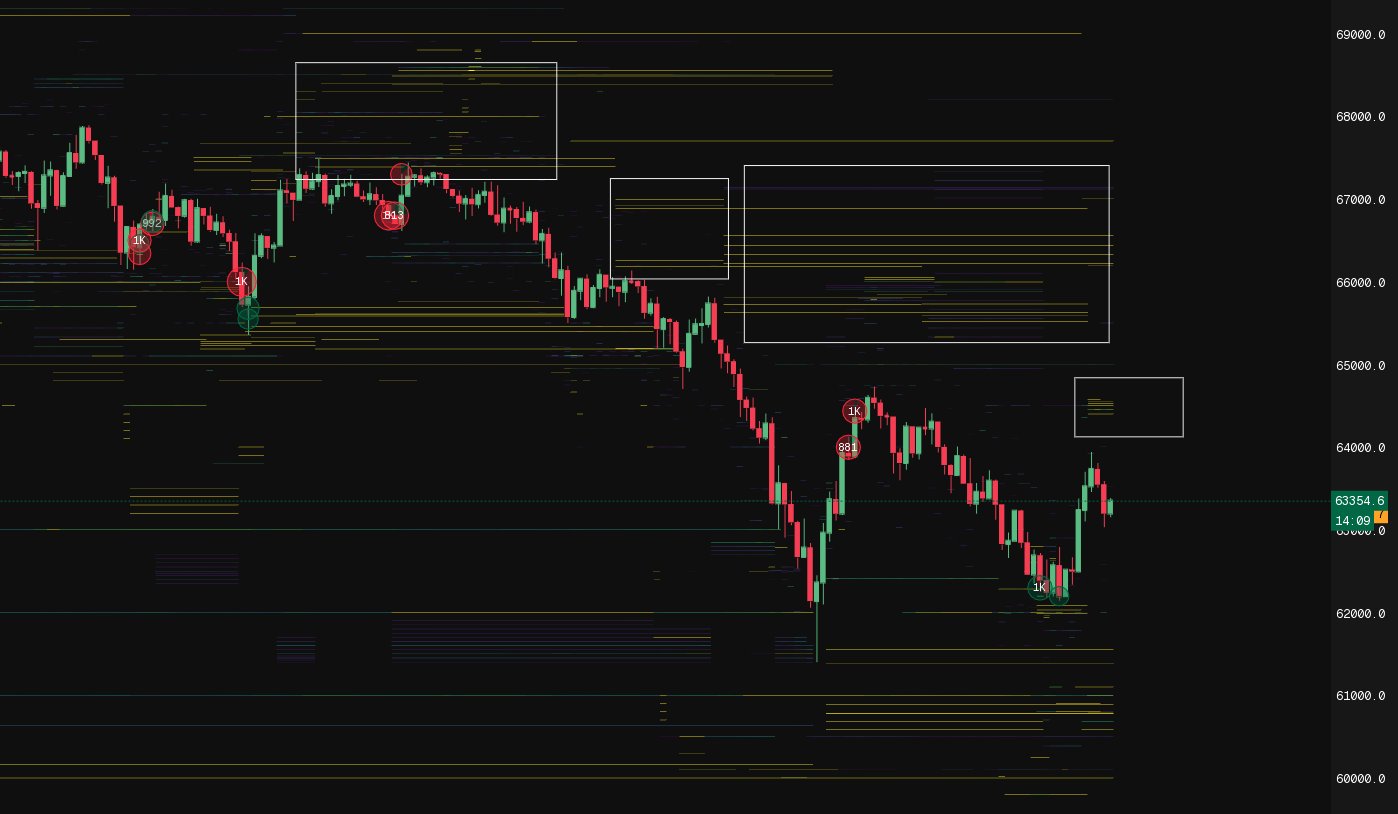
BTC/USDT perpetual contract (Binance) chart with order-book liquidity. Source: Exitpump/X
Analysis notes “incredible” 2022 BTC price replay
At more than 13%, BTC/USD thus faced its worst week of 2026 so far, per data from CoinGlass.
Related: Trump says Iran will ‘work out well’: Five things to know in Bitcoin this week
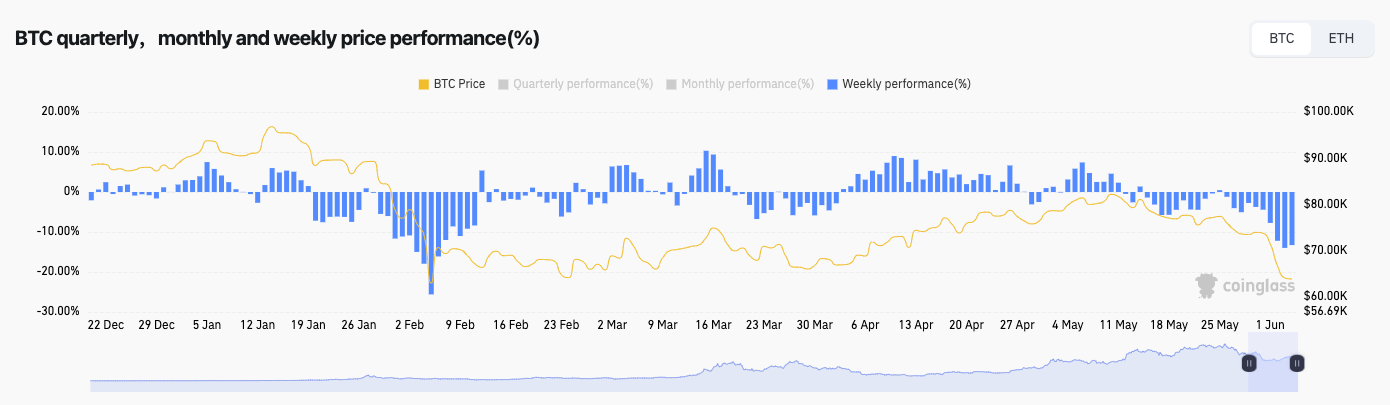
BTC/USD weekly performance (screenshot). Source: CoinGlass
Continuing on the 200-week trend line, meanwhile, currently at $61,626, trader and analyst Rekt Capital made the case for ongoing four-year BTC price cycles.
“On the 13th of June 2022, Bitcoin reached the 200-week SMA during its Bear Market correction,” he noted on the day.
“Now in the 2026 Bear Market, Bitcoin has reached the 200-week SMA almost exactly to the date 4 years later. Bitcoin Cycles are incredible.”
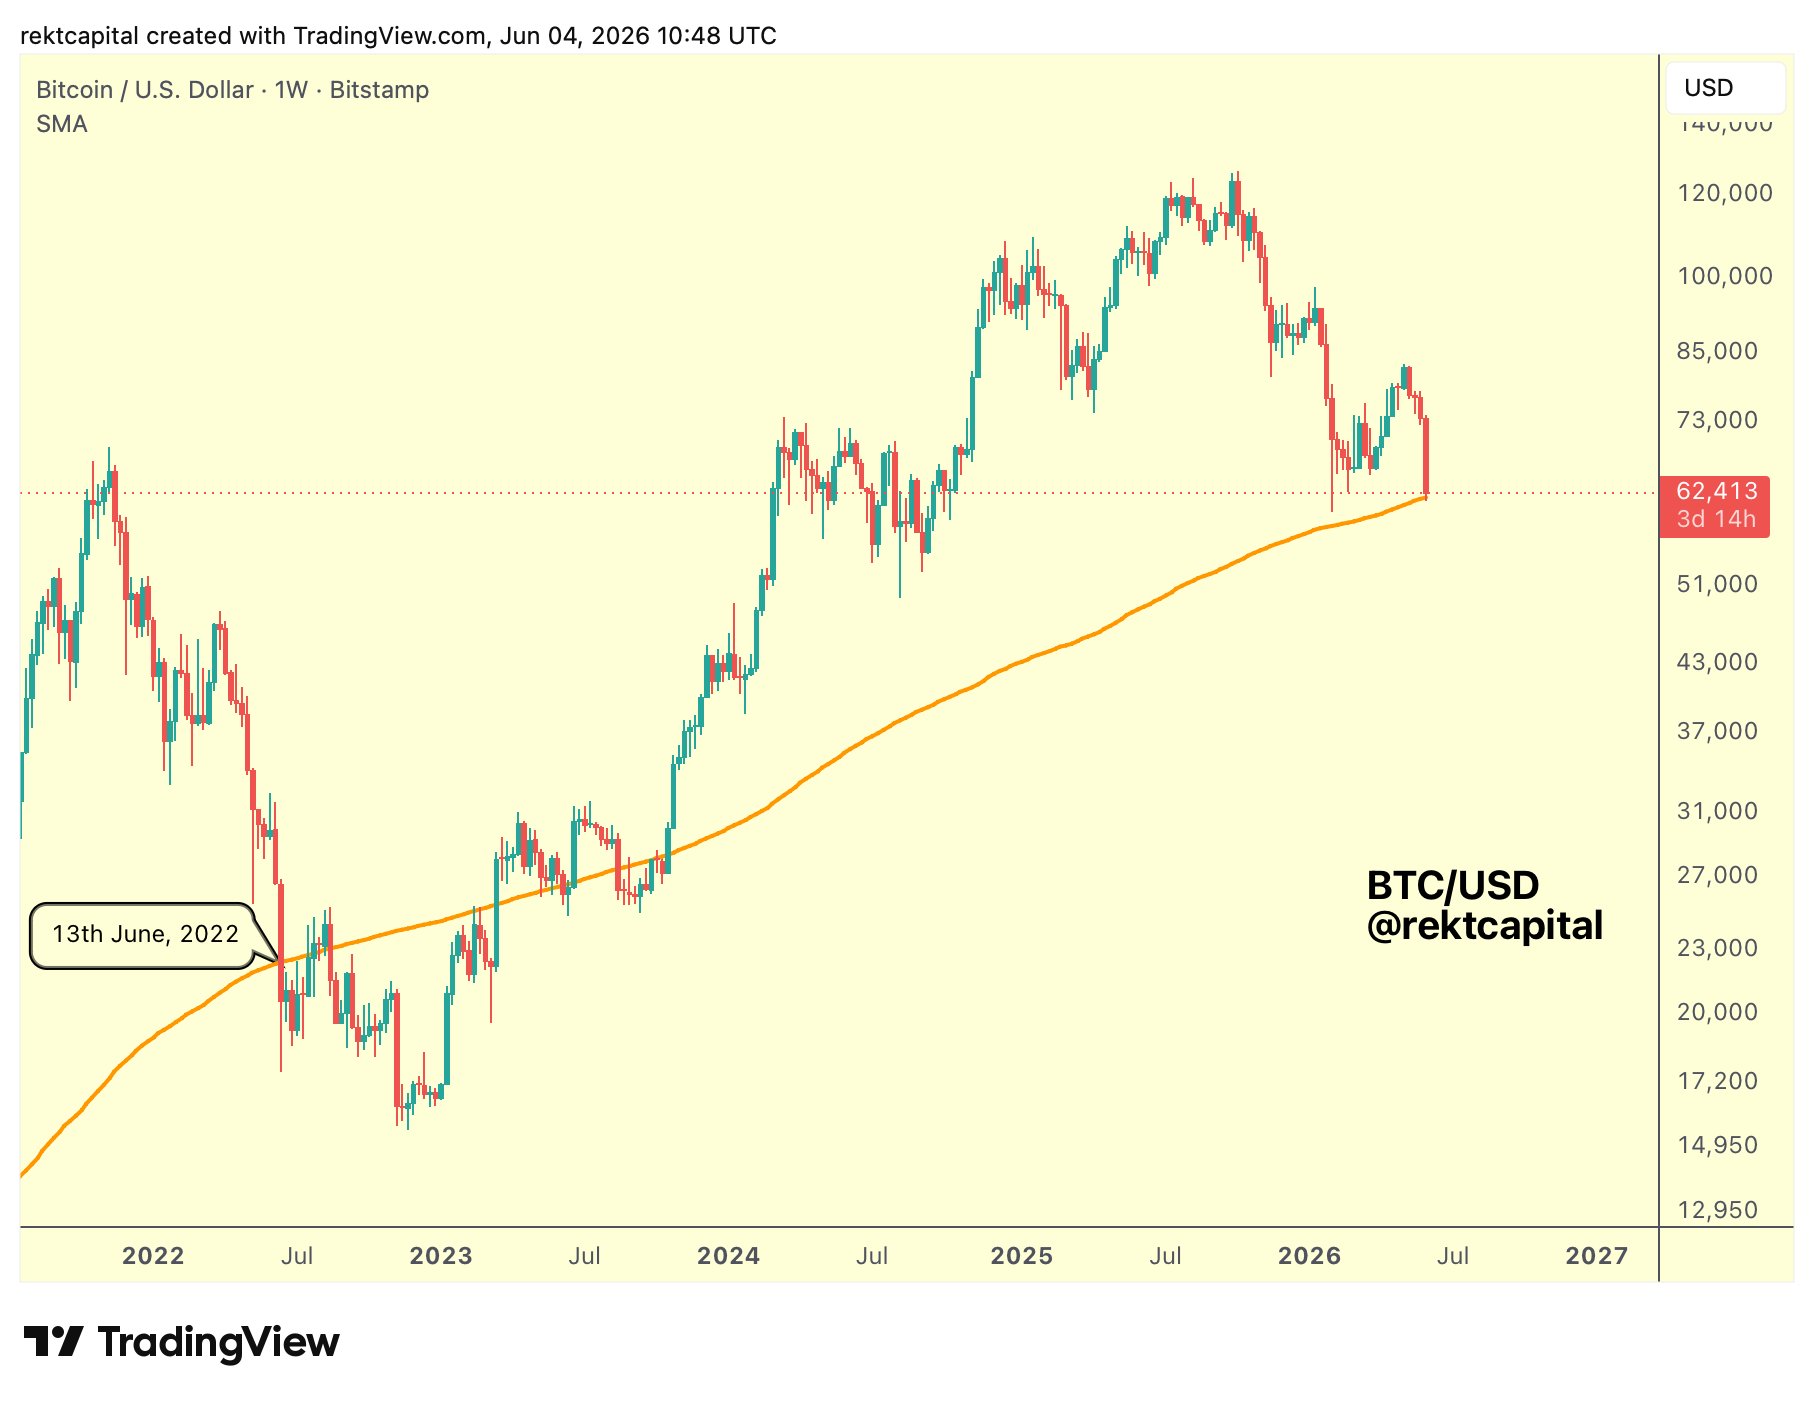
BTC/USD one-week chart with 200SMA. Source: Rekt Capital/X