


XRP (XRP) is down roughly 64% from its July 2025 multi-year high, but several onchain and technical indicators suggested the altcoin was due for a “strong price rebound.”
Key takeaways:
- XRP’s MVRV ratio fell to -47%, a level historically linked to strong market rebounds and accumulation.
- XRP Ledger transaction spikes suggest rising network activity and a possible macro price floor near $1.30-$1.50.
- XRP’s bullish falling wedge pattern projects a 134% price breakout to $3.10.
MVRV ratio: XRP is in an “extreme undervalued” zone
XRP’s market value realized value (MVRV) ratio, or the market cap divided by the realized cap, has dropped to levels that have historically aligned with accumulation zones and market bottoms.
The chart shows that XRP’s 30-day MVRV has now fallen to -47%, its lowest level since December 2020.
Related: XRP price risks 50% drop despite 9-day ETF inflow streak
This suggests that fear and frustration among investors have “reached rare extremes that have historically preceded strong rebounds,” onchain data provider Santiment said in a Tuesday post on X, adding:
“Historically, MVRV’s (average trading returns) will always average out to 0%, making this current level an extreme undervalued zone for $XRP. ”
XRP MVRV ratio. Source: Santiment
Deeply negative MVRV readings tend to appear when retail traders have largely given up, creating conditions where even small positive catalysts can trigger strong rallies.
While weak MVRV readings alone do not guarantee complete trend shifts, they “often signal that the majority of panic selling has already occurred and downside risk becomes more limited compared to potential upside,” Santiment added.
Meanwhile, XRP’s MVRV Z-score is hovering near zero, a level that historically aligns with accumulation zones and market bottoms, according to data from Glassnode.
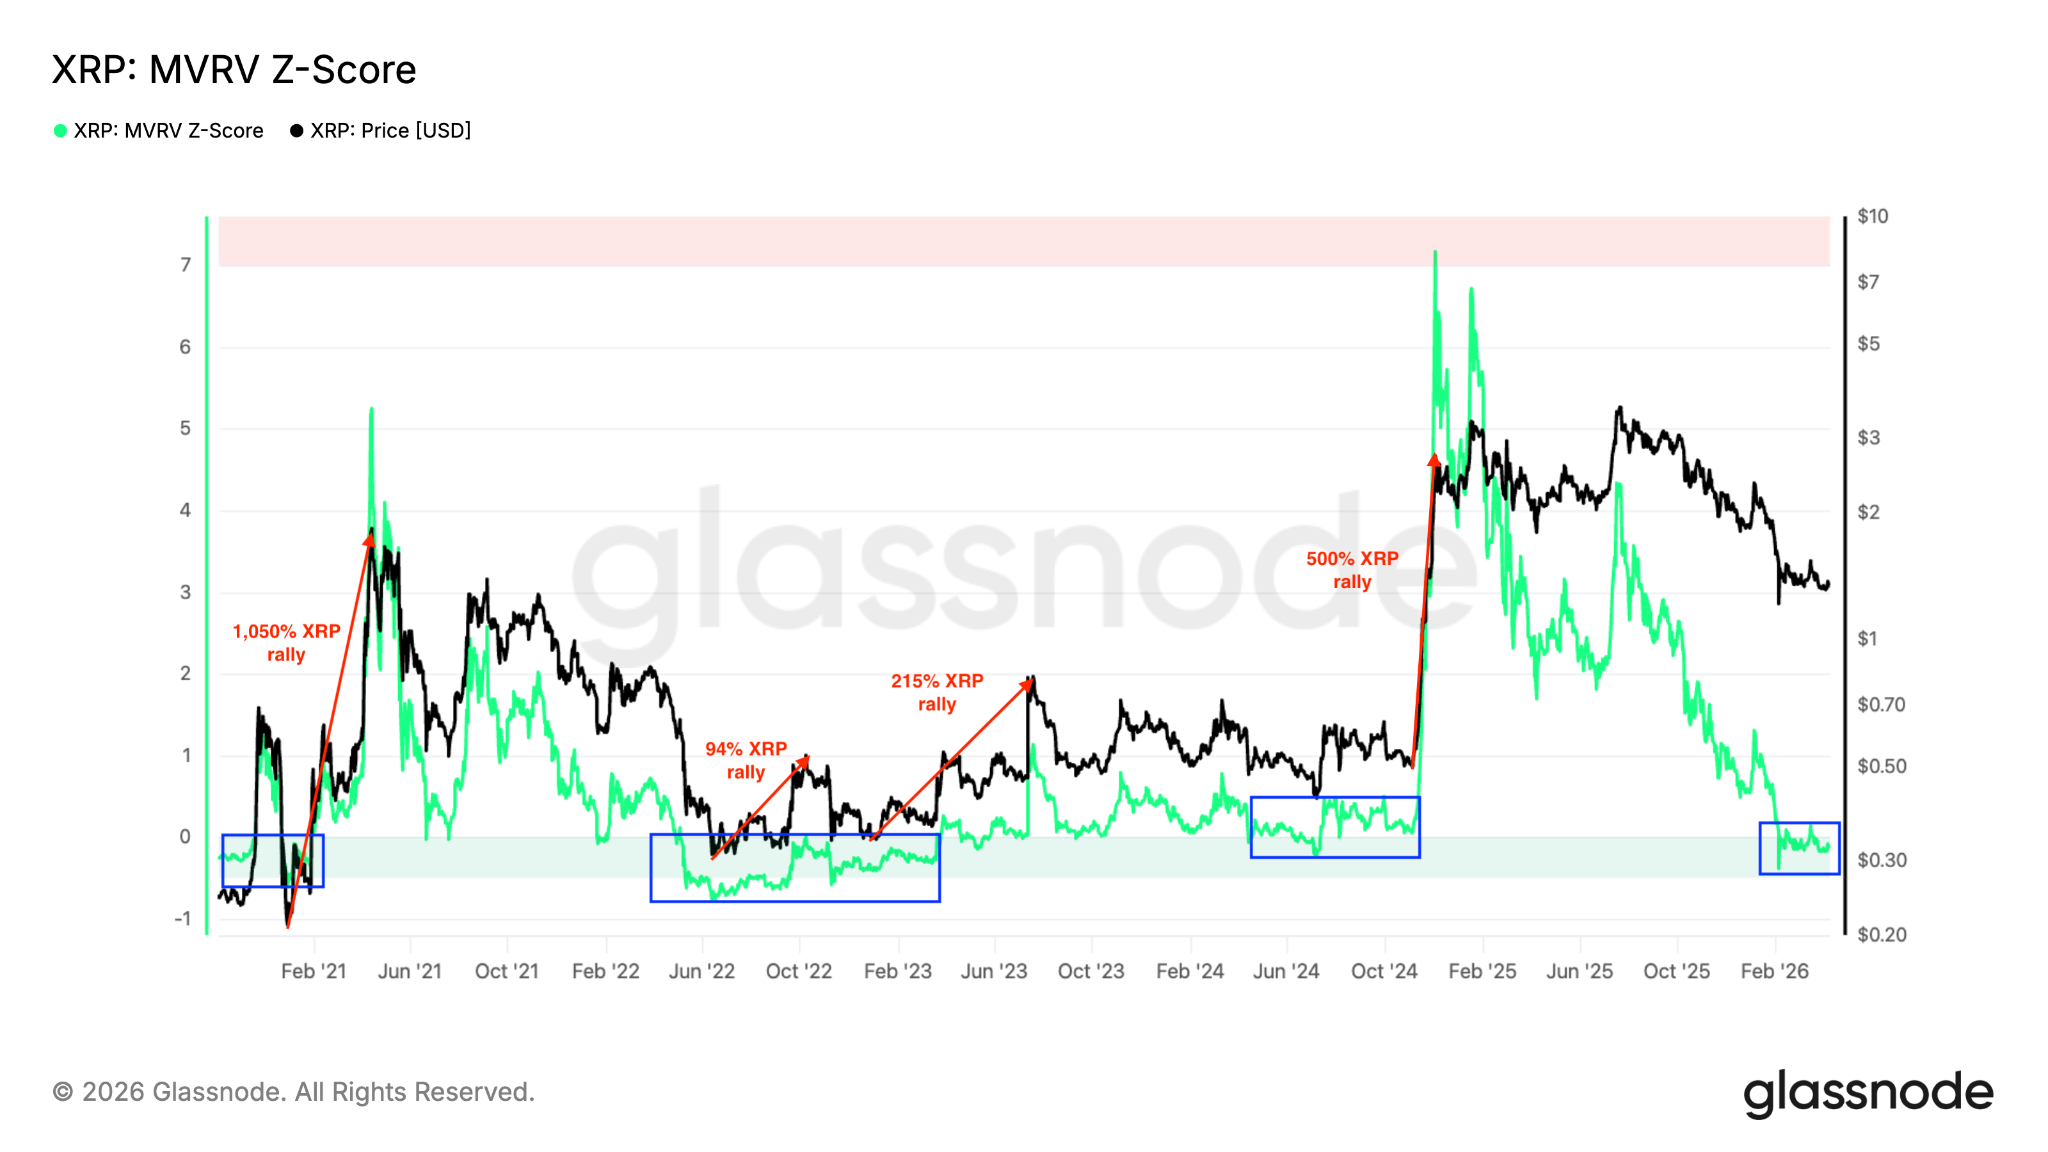
XRP MVRV Z-score vs. price. Source: Glassnode
The last time XRP’s MVRV Z-score fell to similar levels in late 2024, it coincided with a macro market bottom at $0.30 before a rally of 500% to a multi-year high above $3. The gains were 215%, 94% and 1,050% in 2023, 2022 and 2021, respectively.
Analyst: XRP price “creating stable macro floor”
The XRP Ledger saw a massive transaction volume spike in April, suggesting that “deep ecosystem activity and accumulation are quietly building beneath the surface,” CryptoQuant analyst TopNotchYJ said in a Monday Quicktake note.
“Massive, vertical spikes in transaction counts serve as early network leading indicators, predating explosive price expansions,” the analyst added.
In November 2019, a surge in transaction count preceded the 2021 rally from $0.15 to $1.79 (nearly 1,200%). A similar dynamic played out in July 2024, with a gain of 600% to its eventual cycle peak of $3.17 in mid-2025 from $0.50.
XRP is currently consolidating within the crucial $1.30–$1.50 accumulation zone, and the massive network spikes suggest that the price is “creating a stable macro floor,” the analyst said, adding:
“If history repeats and this current consolidation solidifies into a launchpad, a conservative 5x macro projection positions XRP’s next major target area between $7.50 and $8.00.”
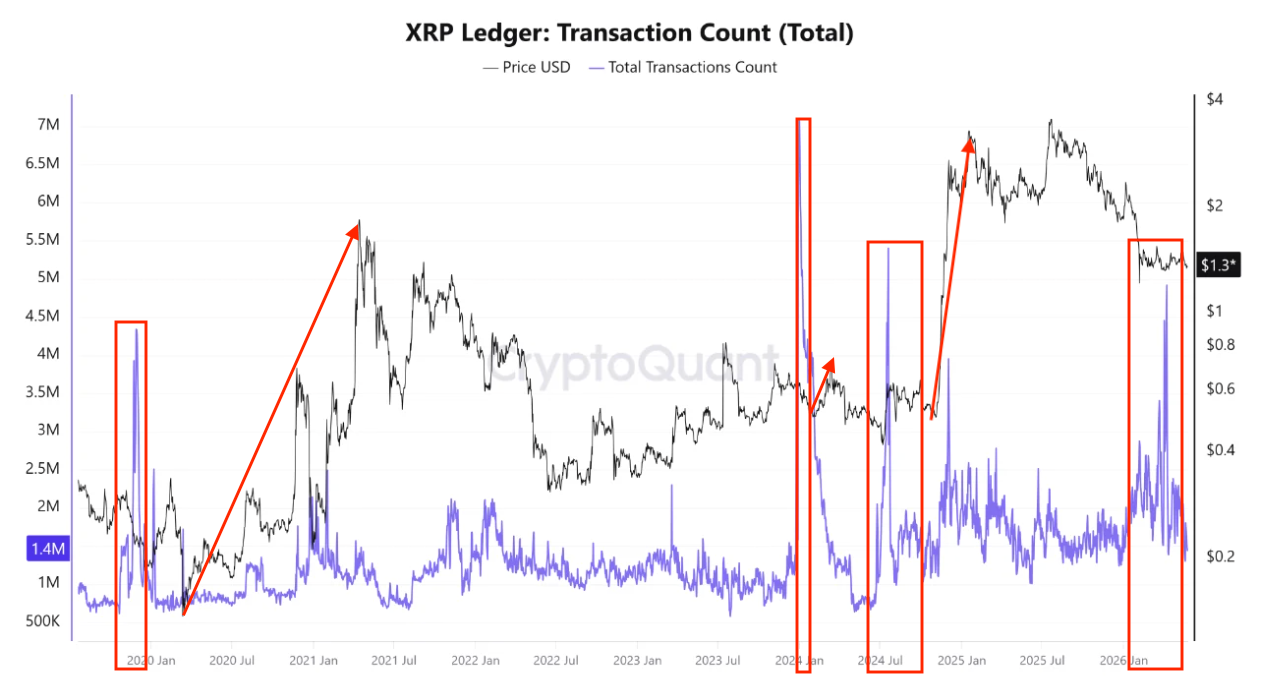
XRP Ledger transaction count. Source: CryptoQuant
As Cointelegraph reported, other key XRP Ledger metrics, such as record whale wallet and monthly transaction counts, suggest that the XRP/USD pair was primed for a strong upward move.
XRP falling wedge breakout targets $3.10
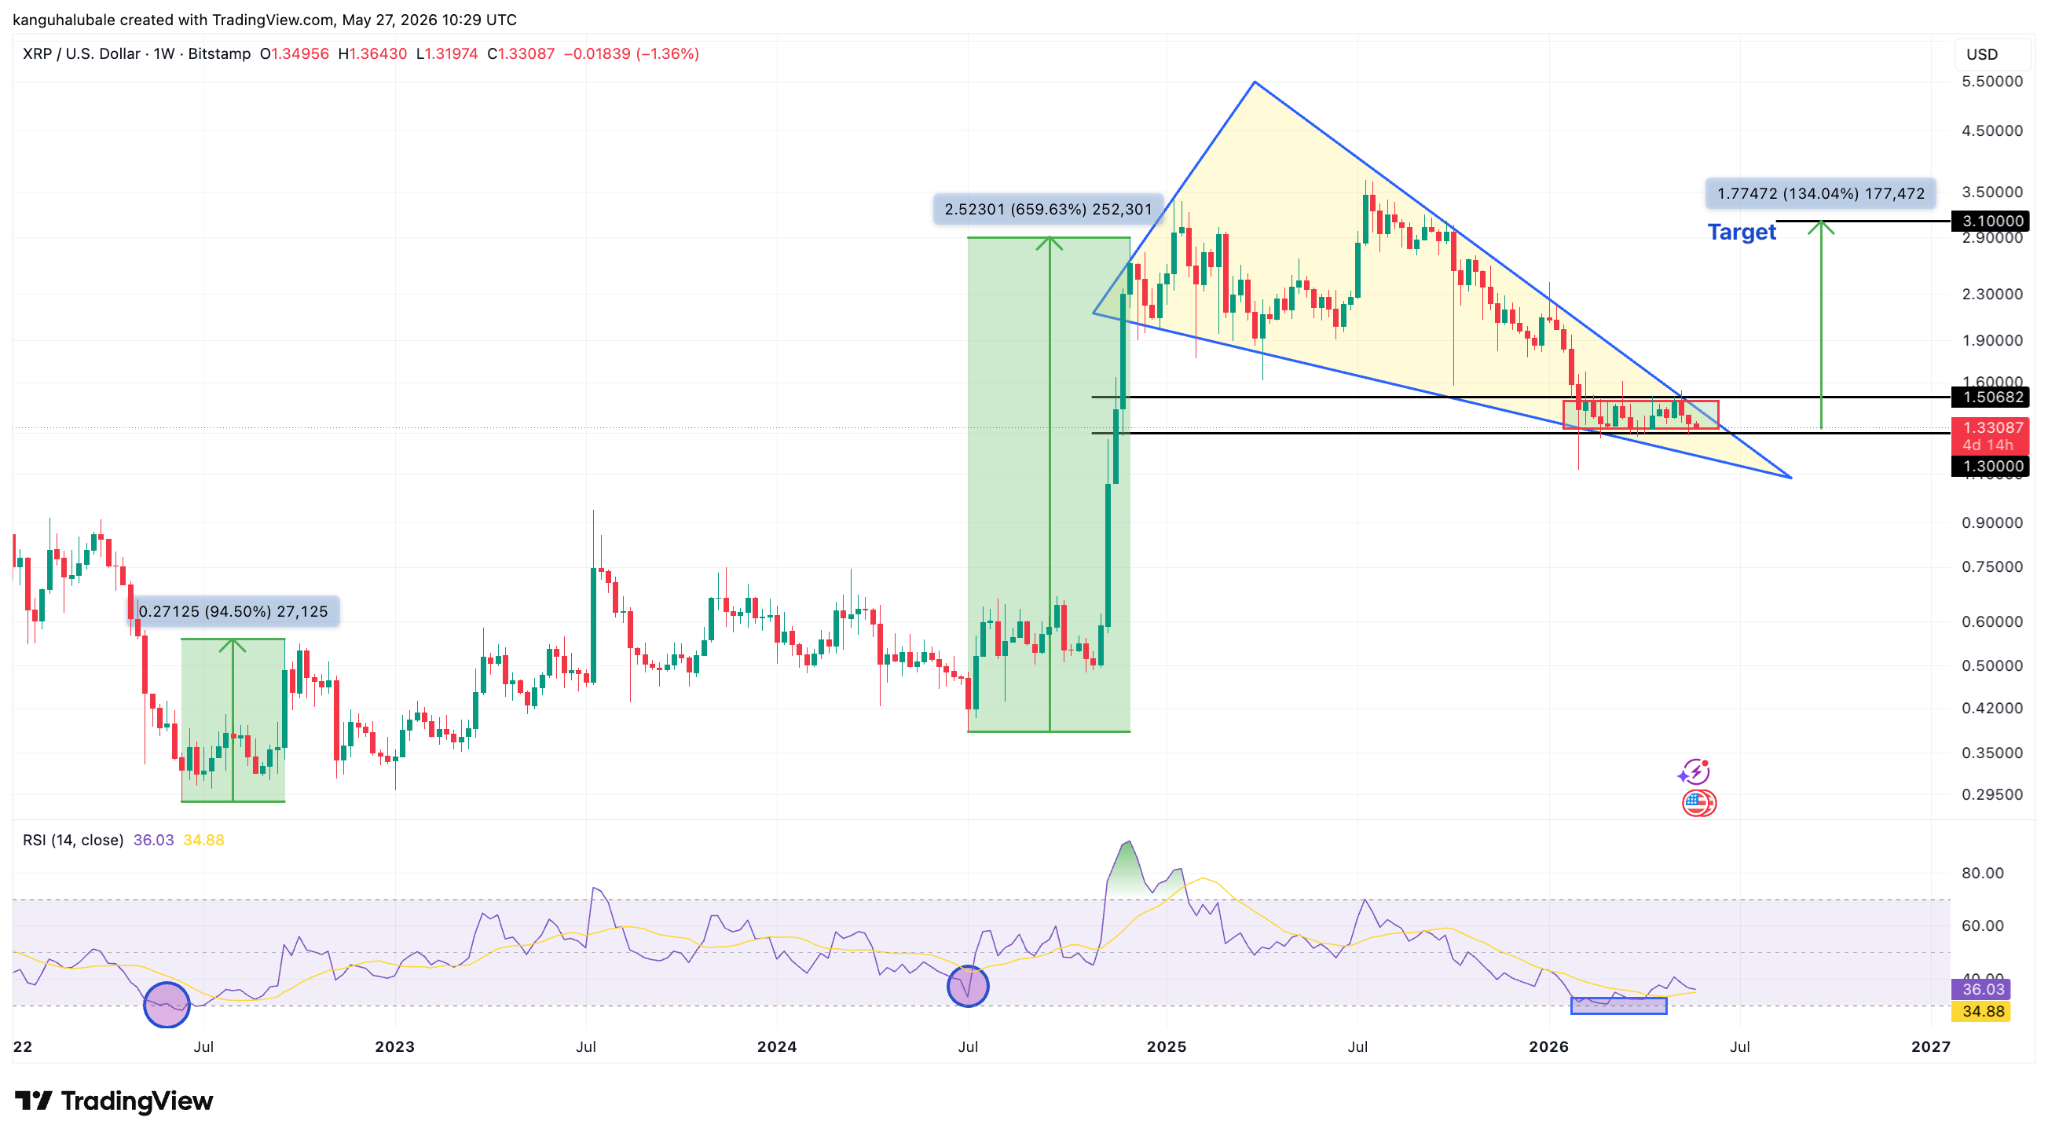
XRP price action is trading within a falling wedge pattern on the weekly chart, a structure typically associated with bullish reversals after a prolonged downtrend.
The price has been compressing between two descending trendlines since July 2025, with the lower boundary now being key support near the $1.30 psychological level
XRP/USD weekly chart. Source: Cointelegraph/TradingView
Meanwhile, the weekly relative strength index (RSI) has recovered from oversold conditions, suggesting that sellers are losing momentum. Historically, similar RSI conditions have preceded strong rebounds in XRP.
For example, XRP rallied as much as 660% between July and December 2024 following the RSI’s recovery from near oversold conditions. The gains were 95% in mid-2022.
A confirmed breakout above the wedge’s upper trend line at $1.50 could open the way for a run toward the measured target of the prevailing chart pattern at $3.1, about 134% above the current price.
As Cointelegraph reported, buyers will have to break and sustain the XRP price above the $1.40-$1.60 resistance zone on the daily chart to confirm a long-term trend shift.